
Moonie - Getting Started Guide
!! PLEASE NOTE: MOONIE IS NO LONGER SUPPORTED !!
01 - Initial Setup
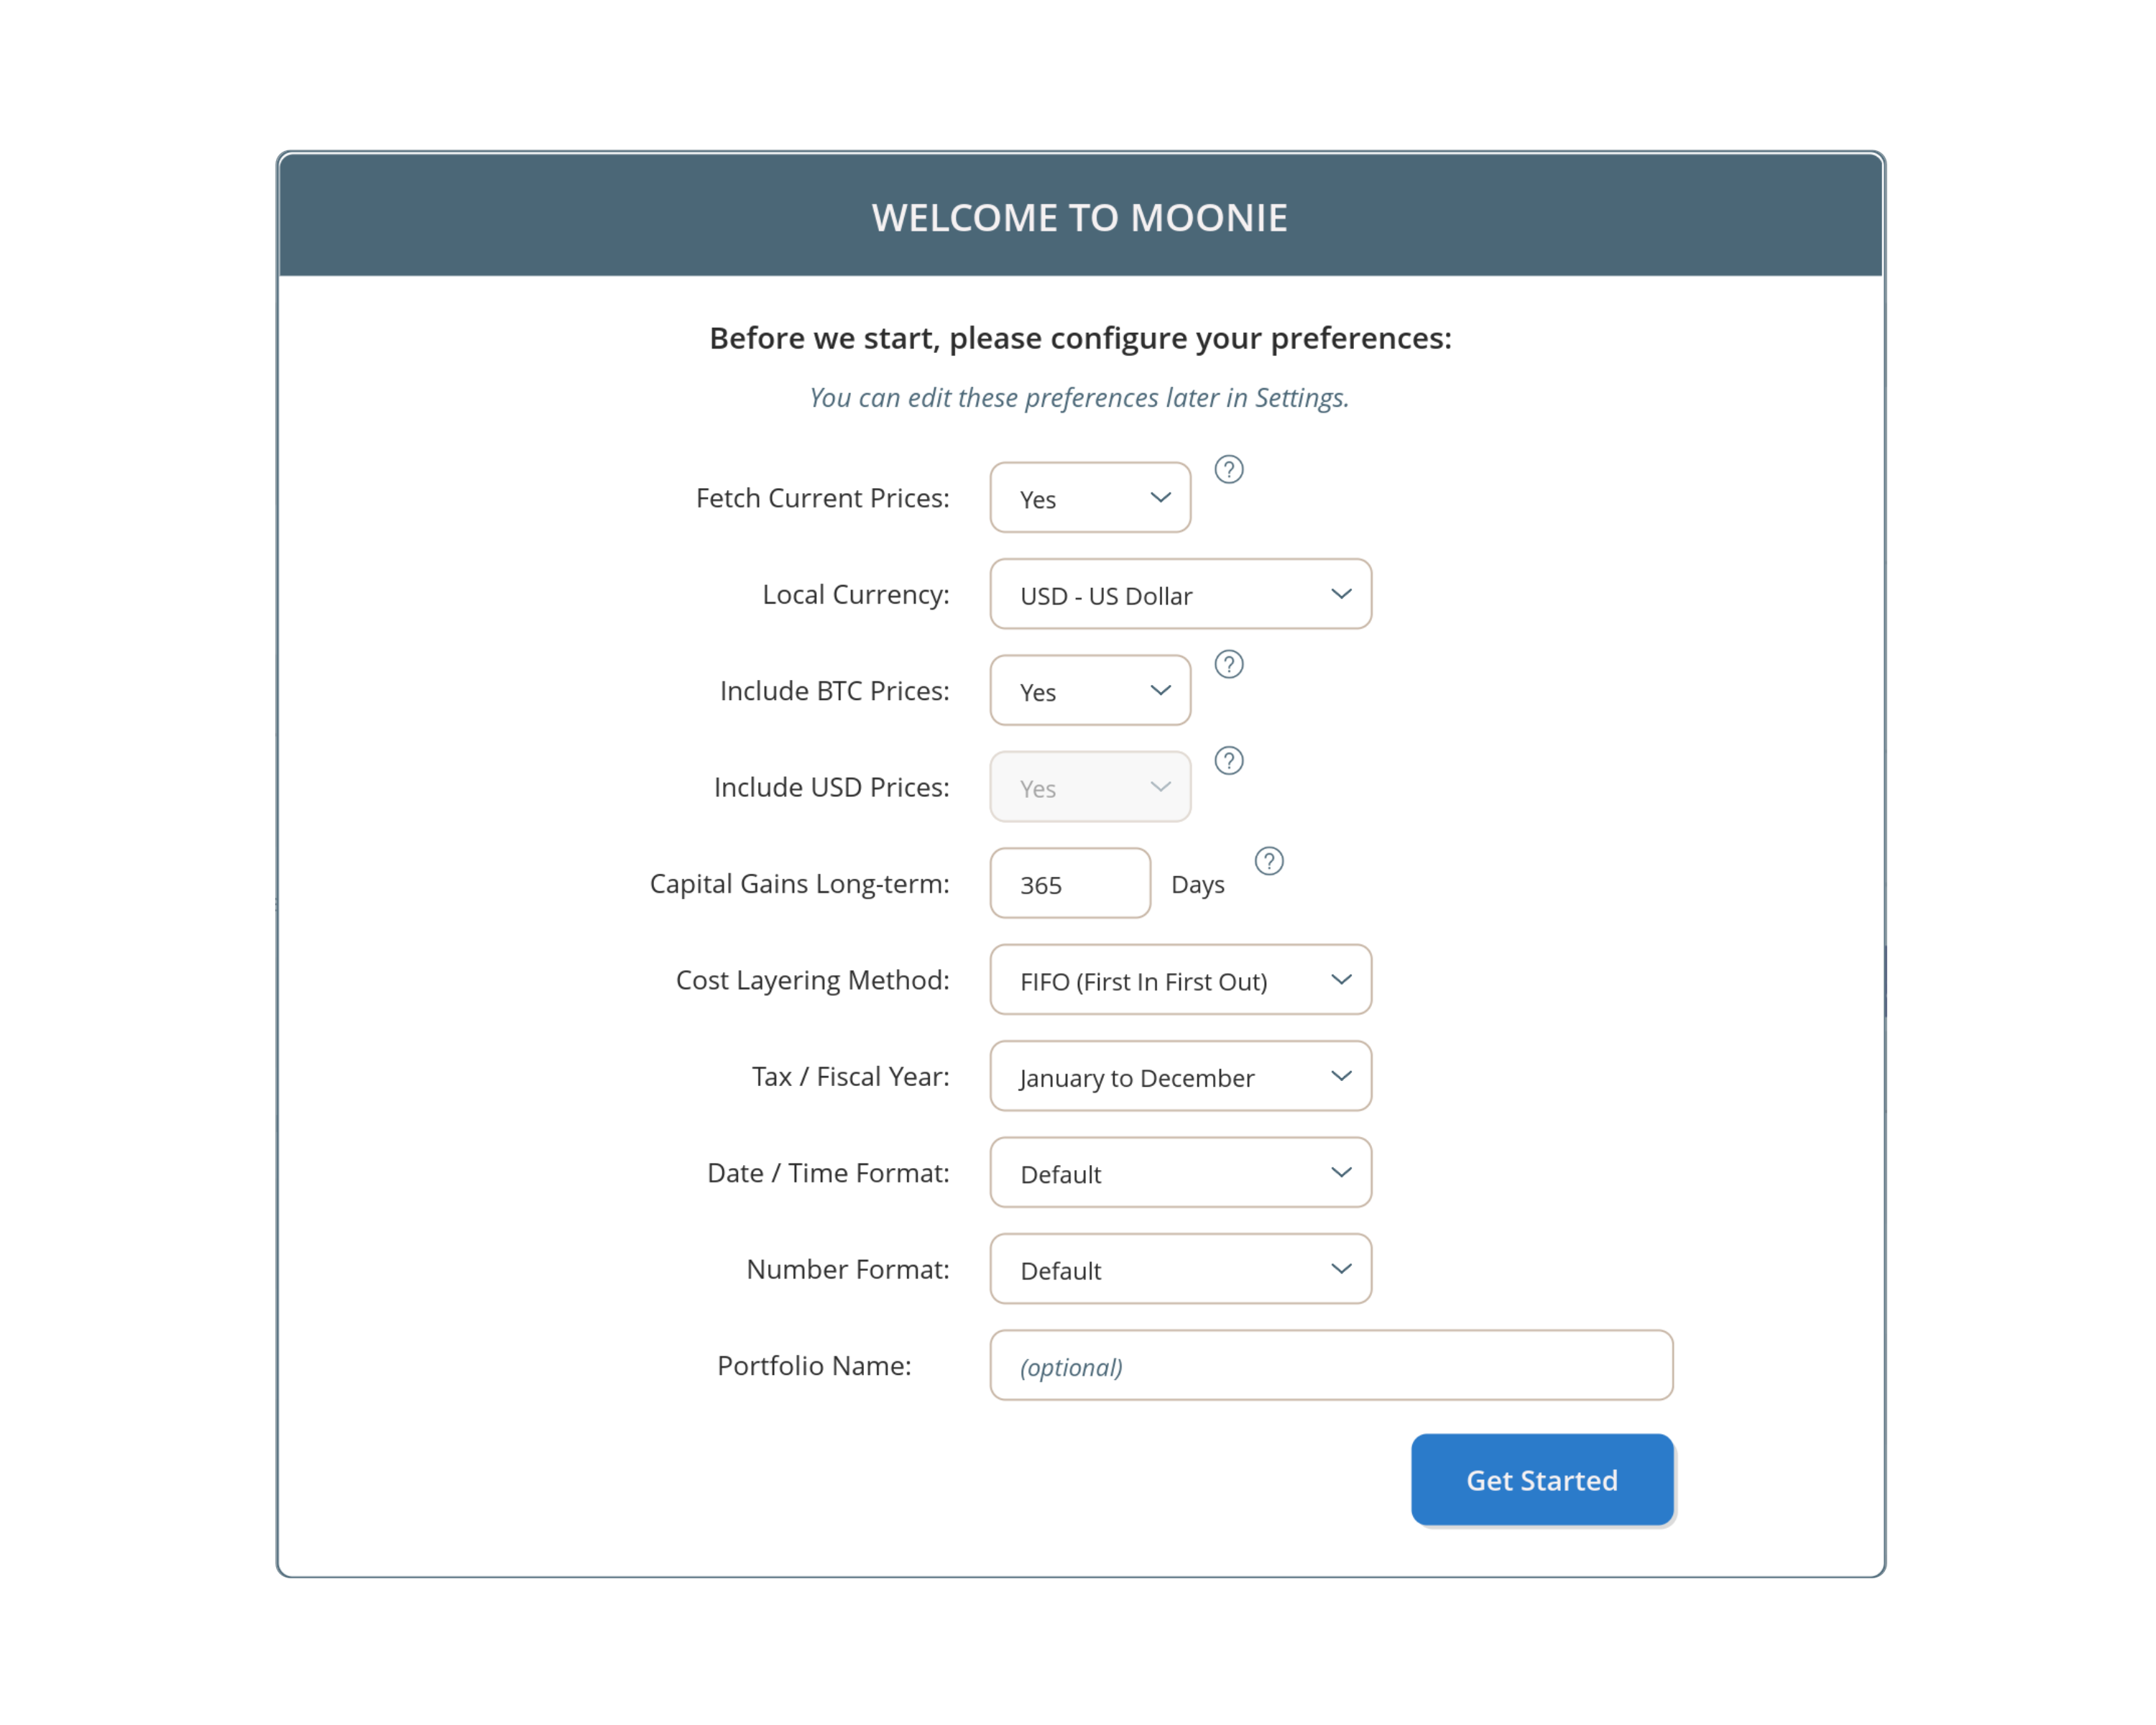
Upon loading Moonie for the first time, you will be greeted with a setup window. Your configuration settings chosen
here will determine how Moonie processes your data and populates reports accordingly. These settings can be changed at anytime by clicking the
gear icon in the top right corner of the app.
* Please consult with your tax advisor to be sure the settings you choose are correct for your country/jurisdiction.
Configuration options:
• Moonie can be used offline, however, if you enable Fetch Current Prices, Moonie will gather current cryptocurrency prices from various
exchanges online. These prices are used to populate the dashboard with an estimated portfolio value, broken down by currency and account balances.
• Local Currency is the currency you use for tax reporting purpose. Moonie will display all values in this currency.
• Include Bitcoin Prices will require you to enter BTC historical prices along with Local Currency prices for each transaction. This will
allow you to view your data with either BTC or local currency valuations.
• Include US Dollar Prices will require you to enter USD historical prices along with Local Currency prices for each transaction. This will
allow you to view your data with either USD or local currency valuations. *This setting will be ignored if your Local Currency is set to USD.
• Fiscal Year is the time period you use for accounting purposes and preparing financial statements.
• Capital Gains Long-term is the length of time an asset is to be held for it to be deemed a Long-term holding.
• Cost Layering Method will determine how Moonie handles outgoing assets for calculating capital gains/losses on transactions.
• Date and Number Format determine how Moonie displays these types of values. Default uses your current computer formatting.
• Portfolio name is an optional feature and will be shown on your dashboard and on exported/printed reports.
02 - Add Transactions
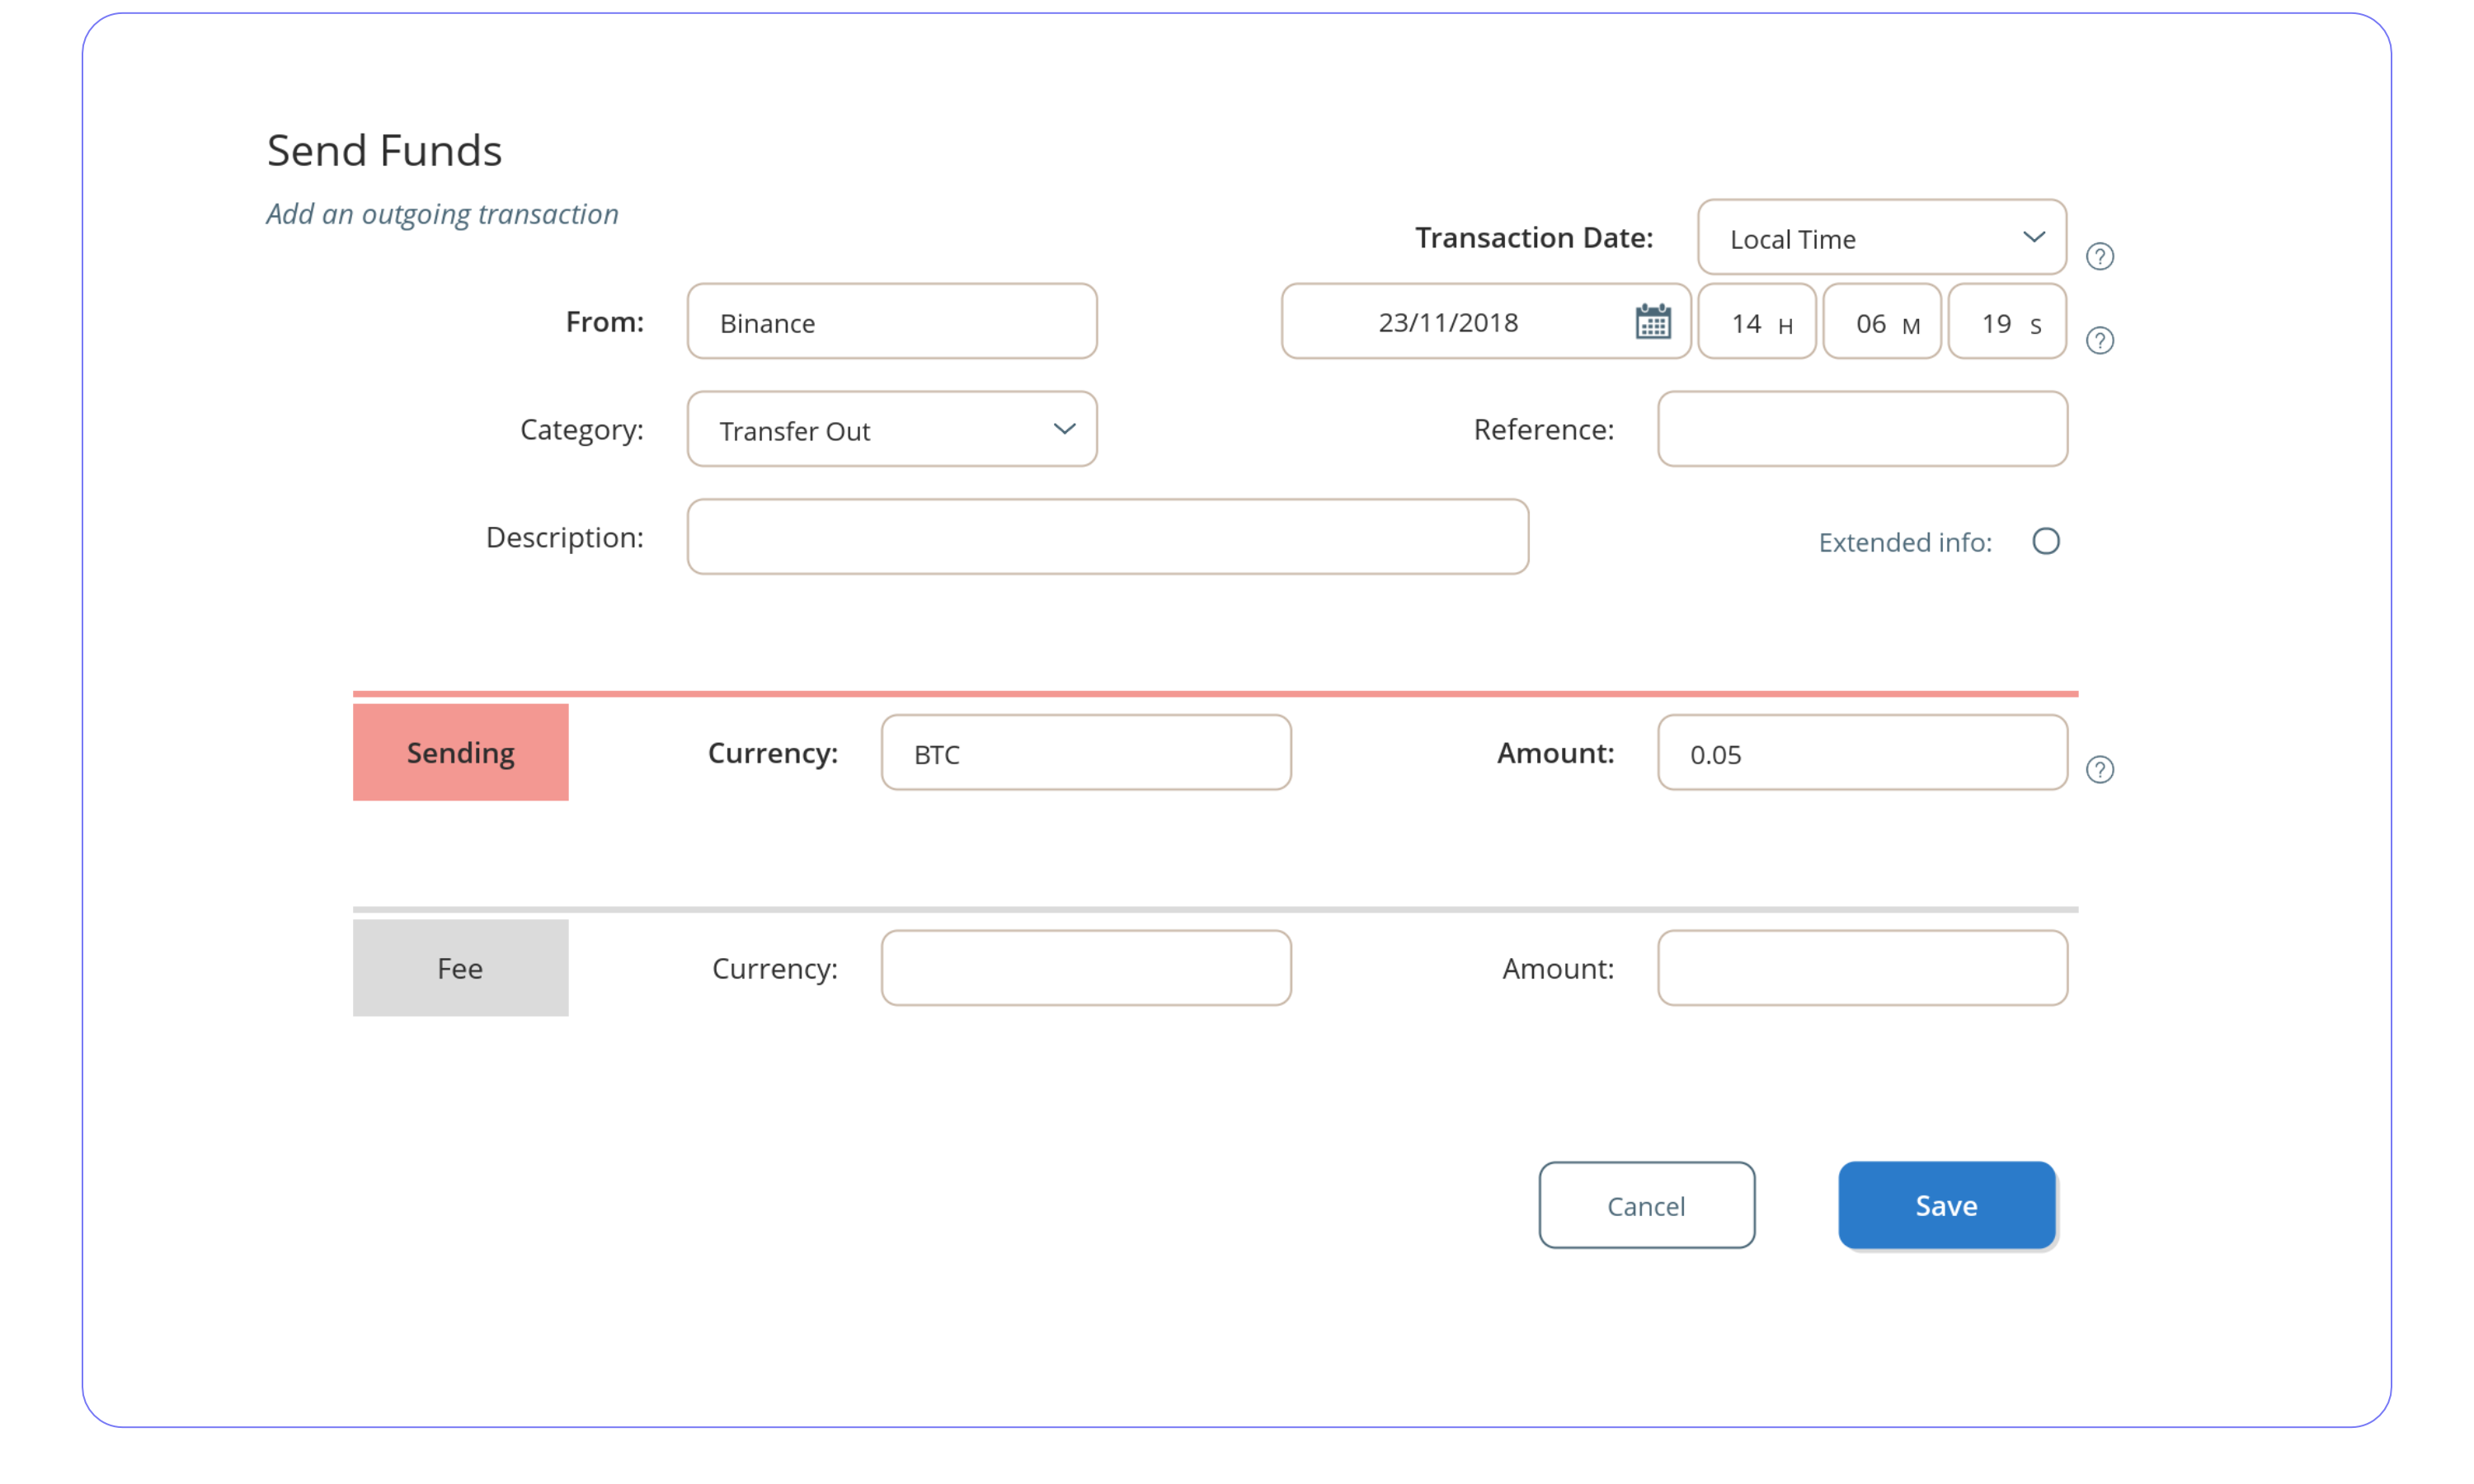
Start adding data via the Transactions tab. Choose the type of transaction you want to add via the sub-header options.
Individually add Send, Receive, Trade and Transfer transactions or add bulk transactions via the CSV file importer.
The most basic requirements for any transaction are the account, currency, amount and the time of transaction. Please note: specify if the time
you’re entering is Universal Time (UTC) or your local time. If UTC, then Moonie will convert to your local time for display and reporting purposes.
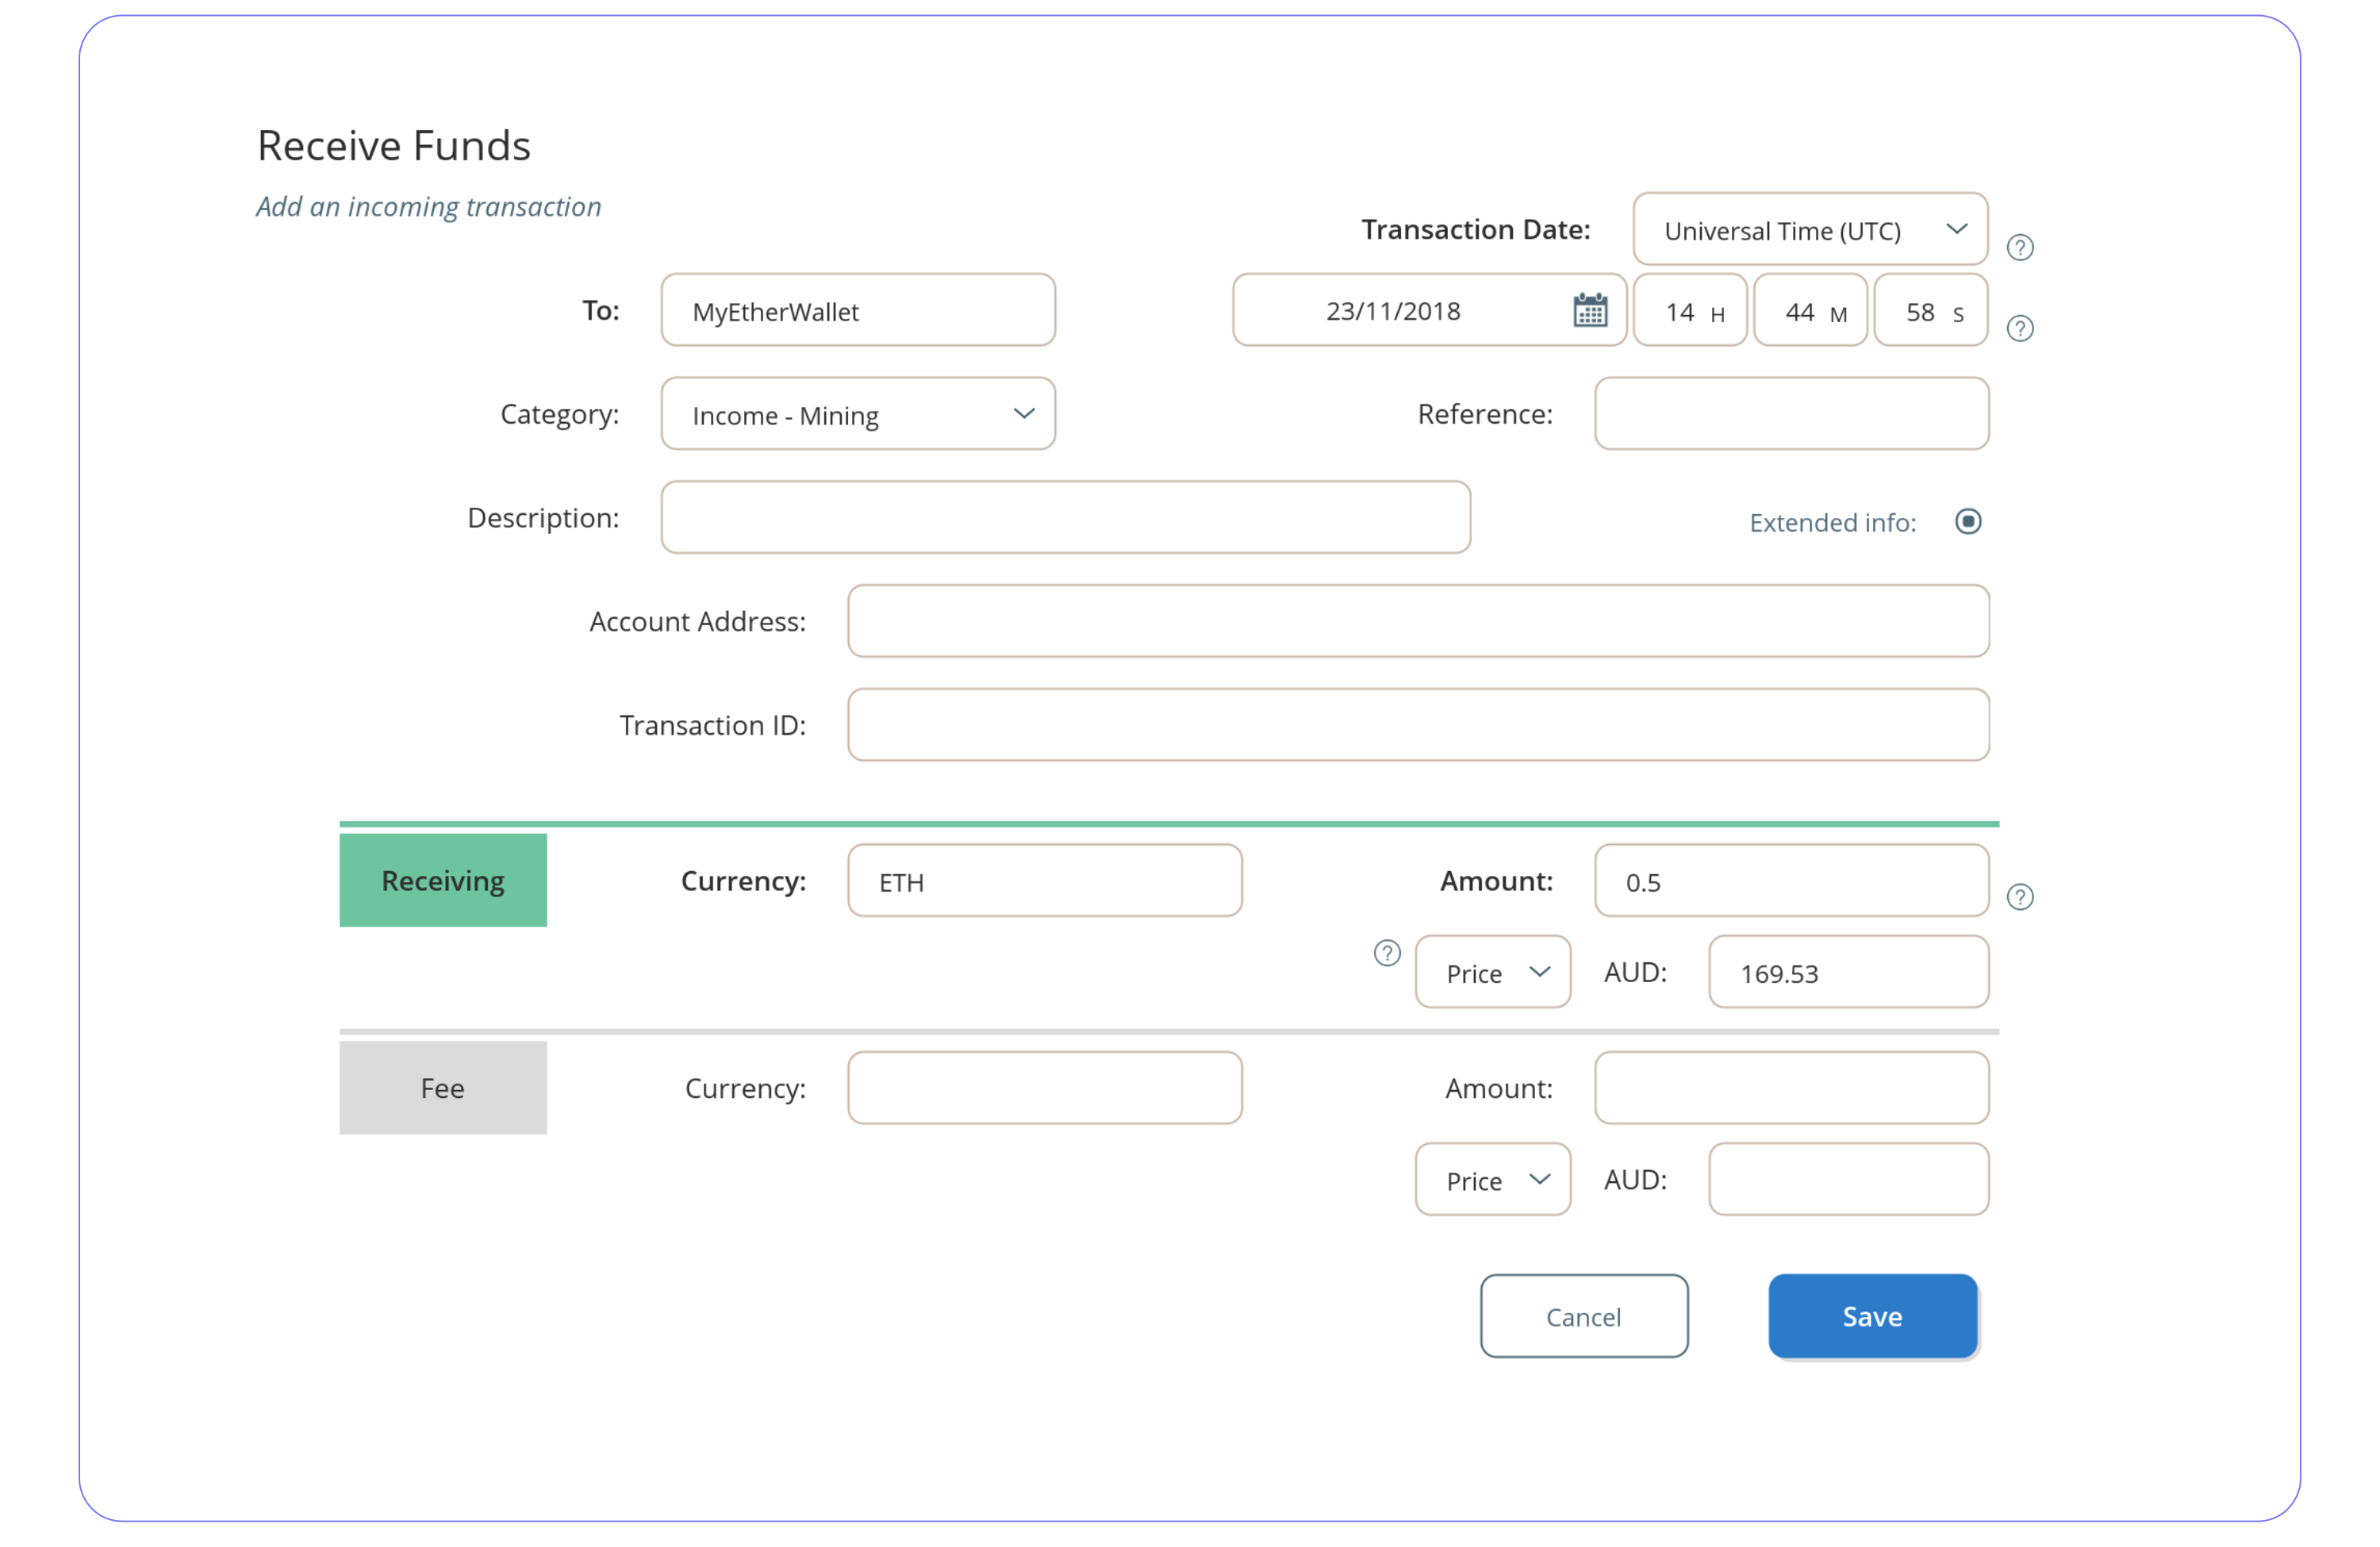
Toggle Extended Info to further add an account address and transaction/trade ID. More importantly, extended info allows you to enter the historical price/s or value/s for the transaction. Historical prices are required for calculating gains. Enter either the cryptocurrency market price (1 unit) at the time of transaction or enter the value of the amount transacted.
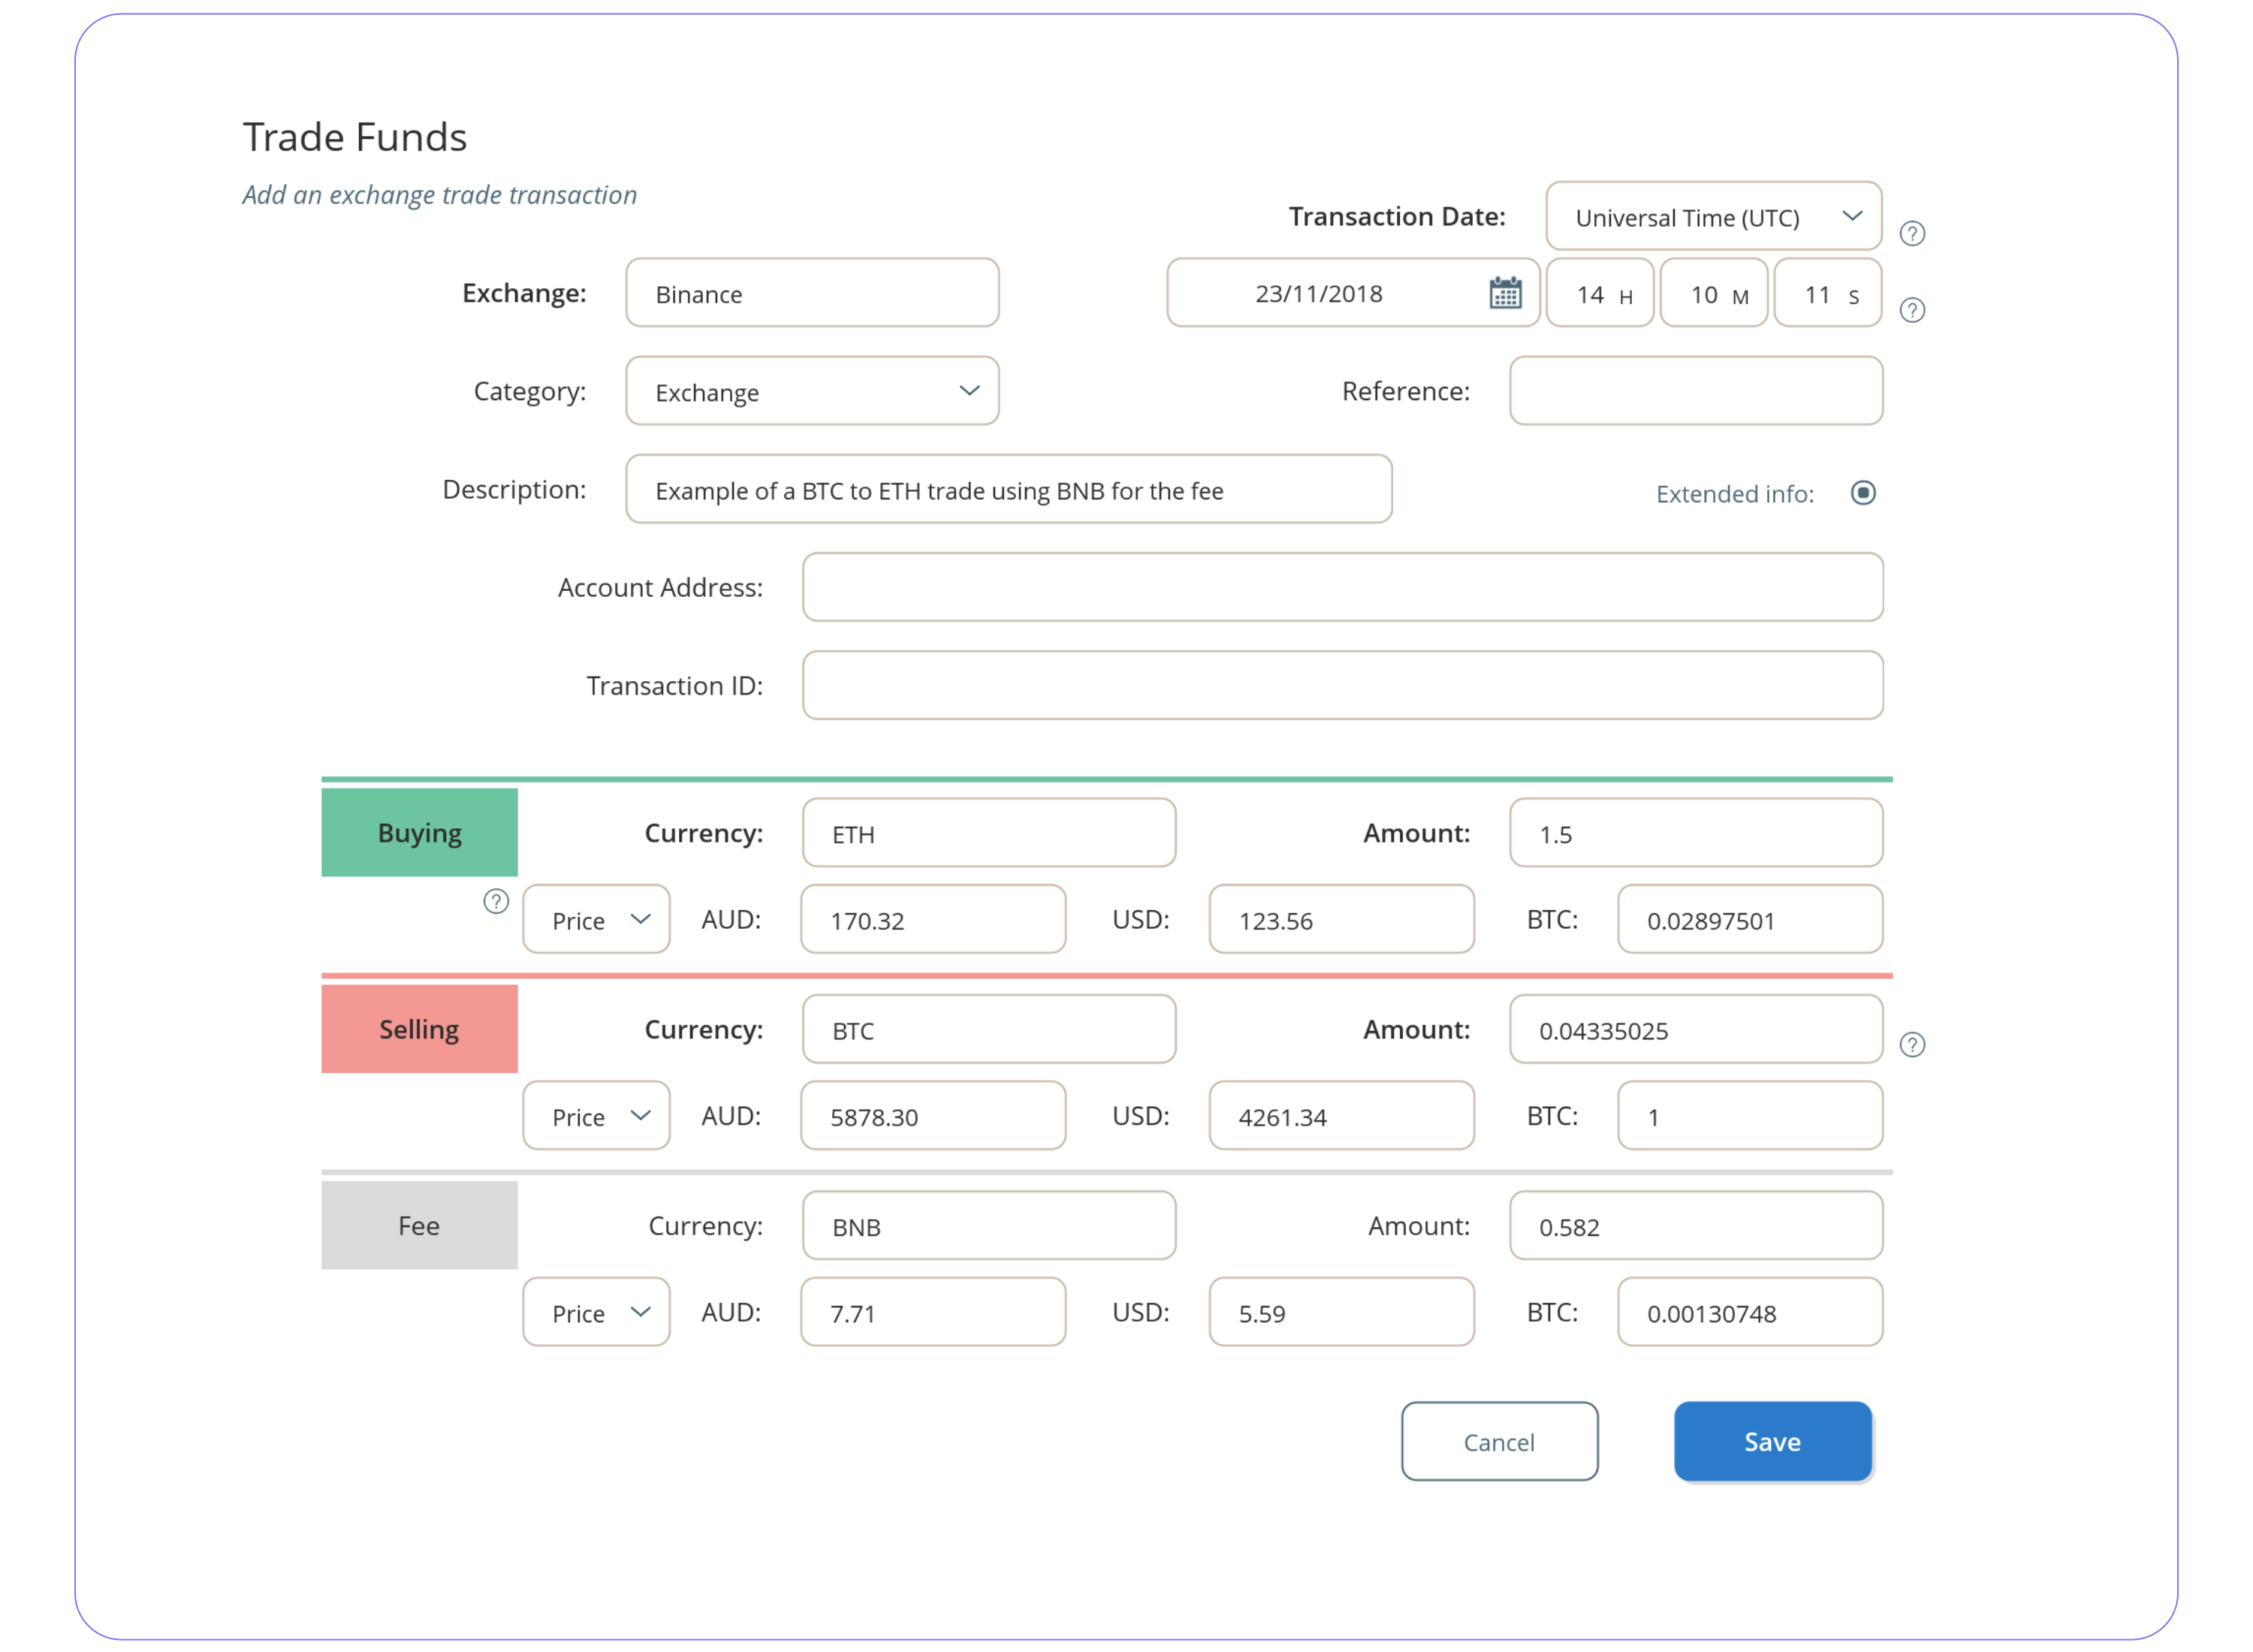
Depending on how many display currencies you have enabled, this will determine how many different historical prices/values are required for the transaction. The following example is using AUD as the local currency with USD and BTC prices included as optional currencies. This will allow the user to view their portfolio and generate reports in any one of these three currencies.
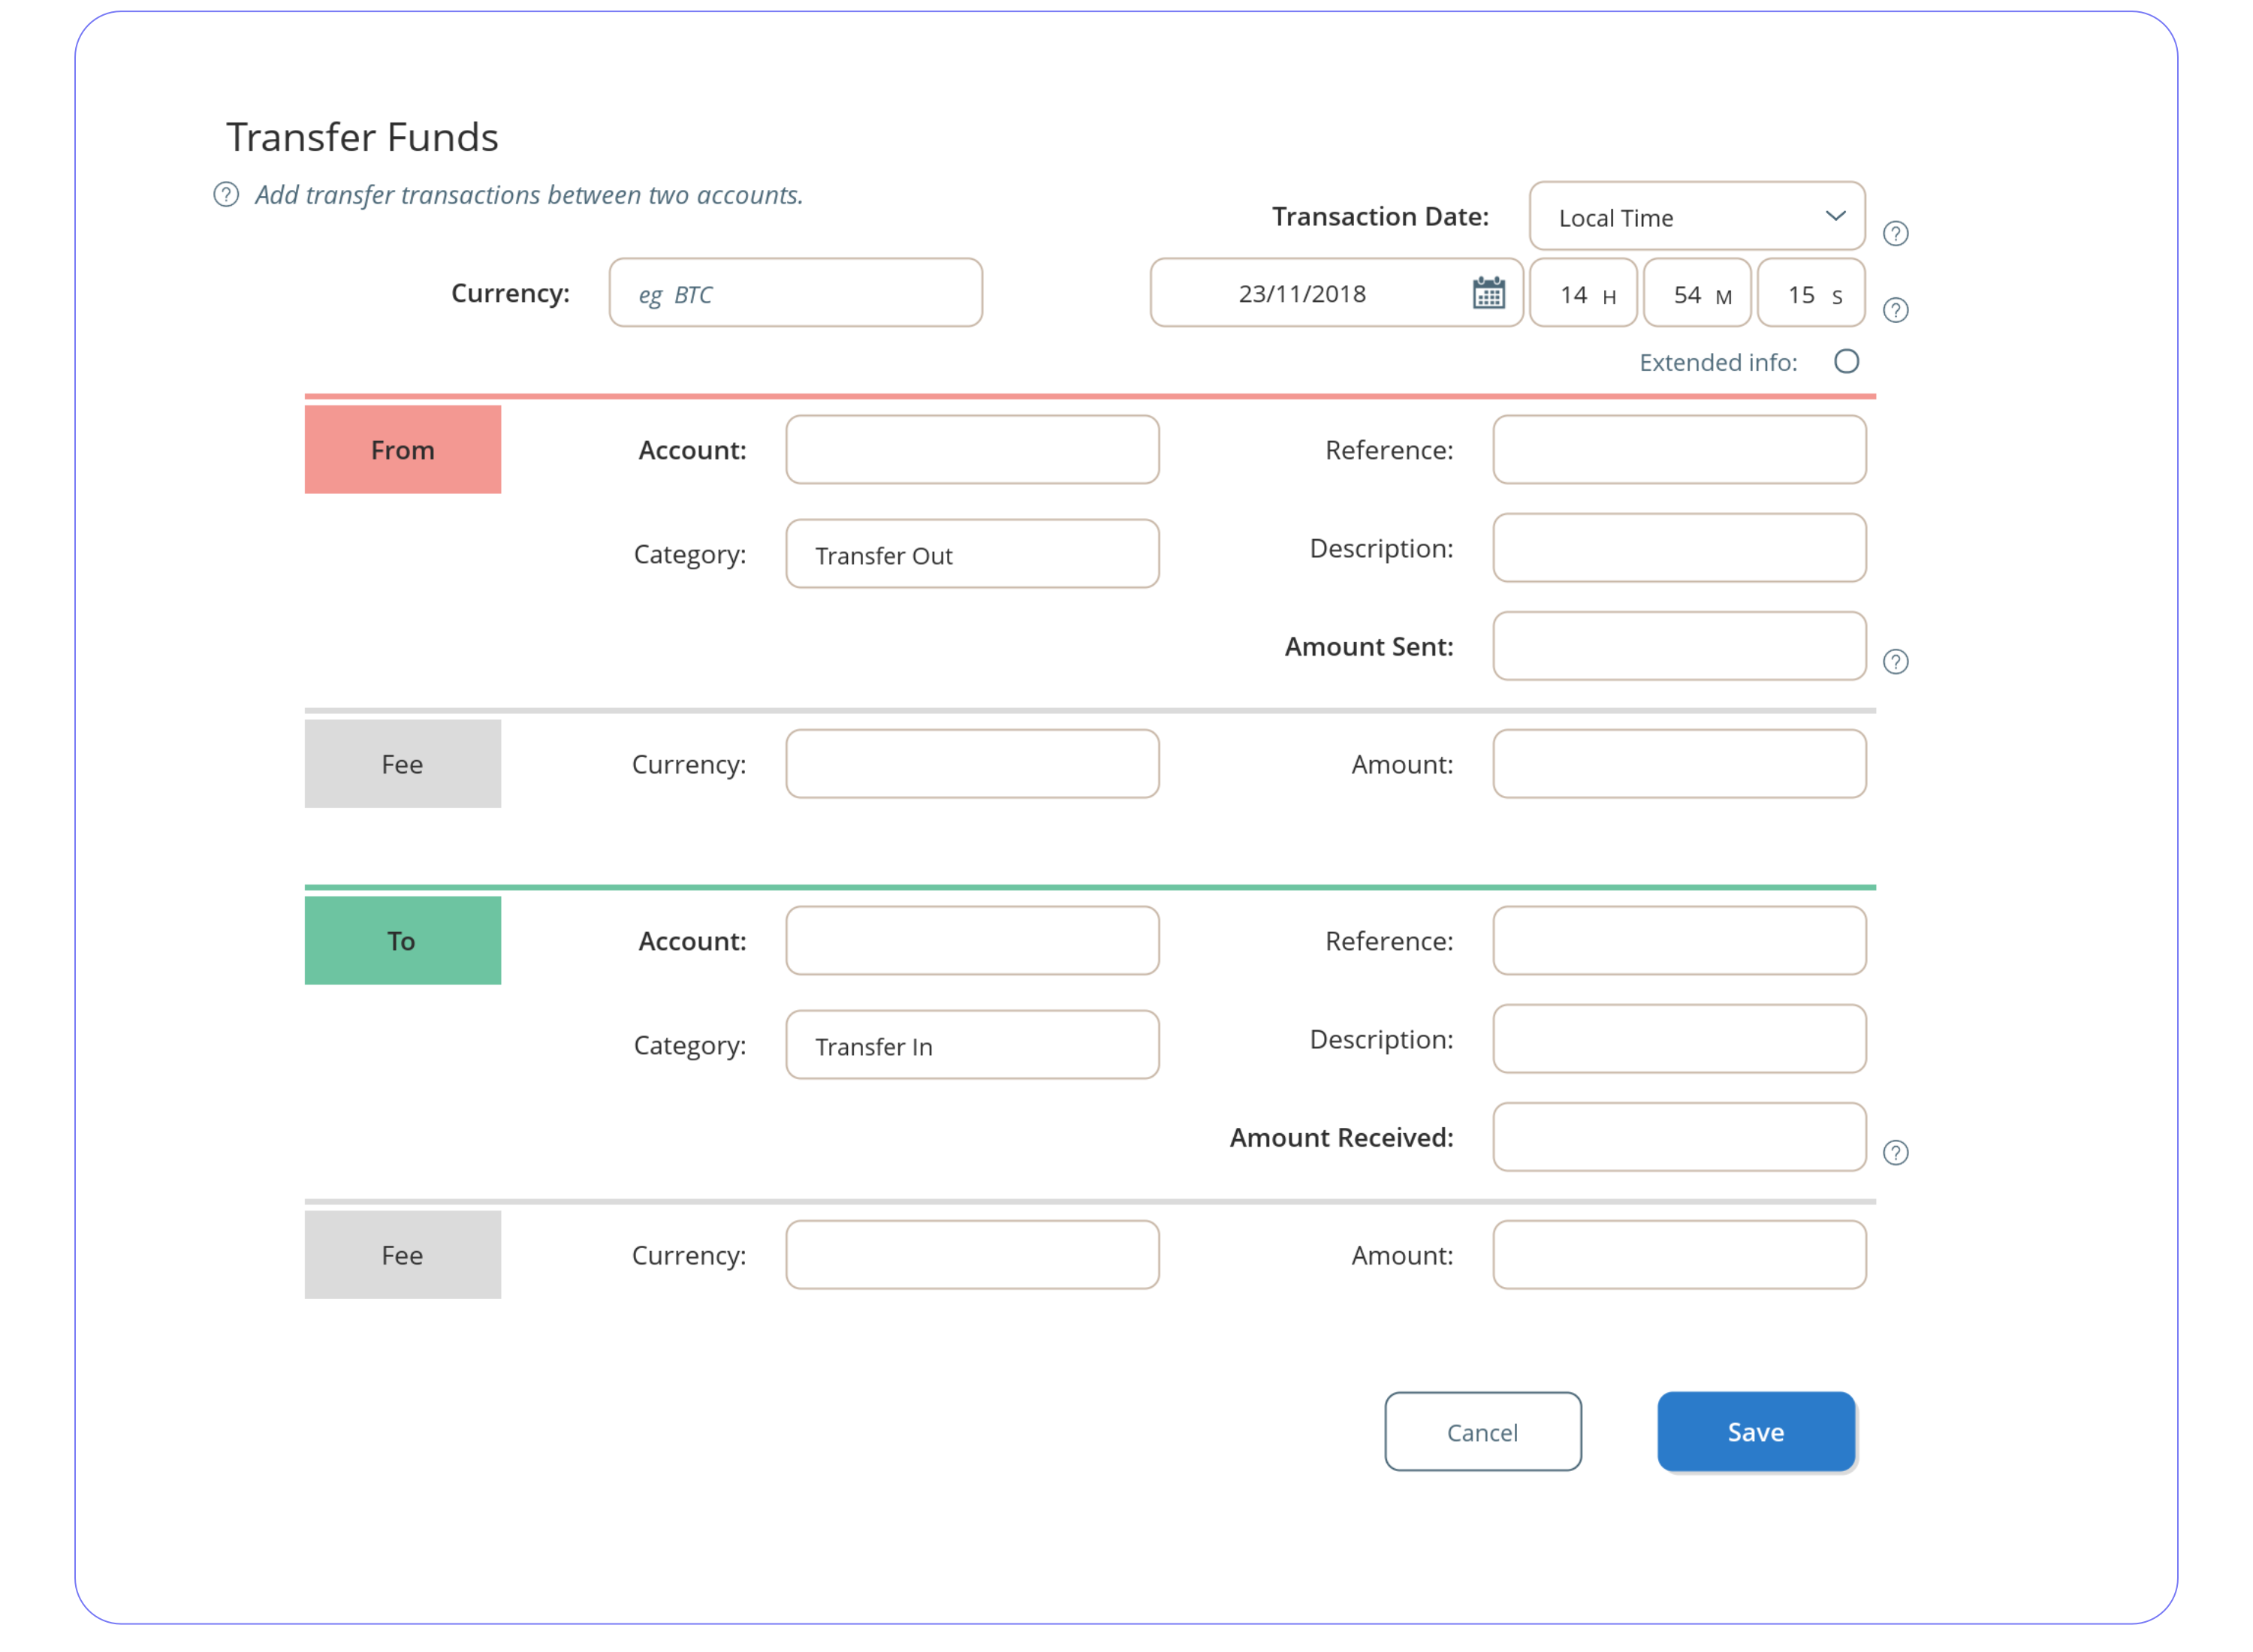
Transfers (In and Out) are for moving your currencies between your own accounts. Transfers are not classed as a taxable events
(capital gains) and will not effect your short to long-term hold status. Historical prices for transfers are not required.
If a transfer fee was paid, then the fee itself is classed as an expense and any applicable gains on the fee will be accounted for. A historical price
for the fee currency will be required.
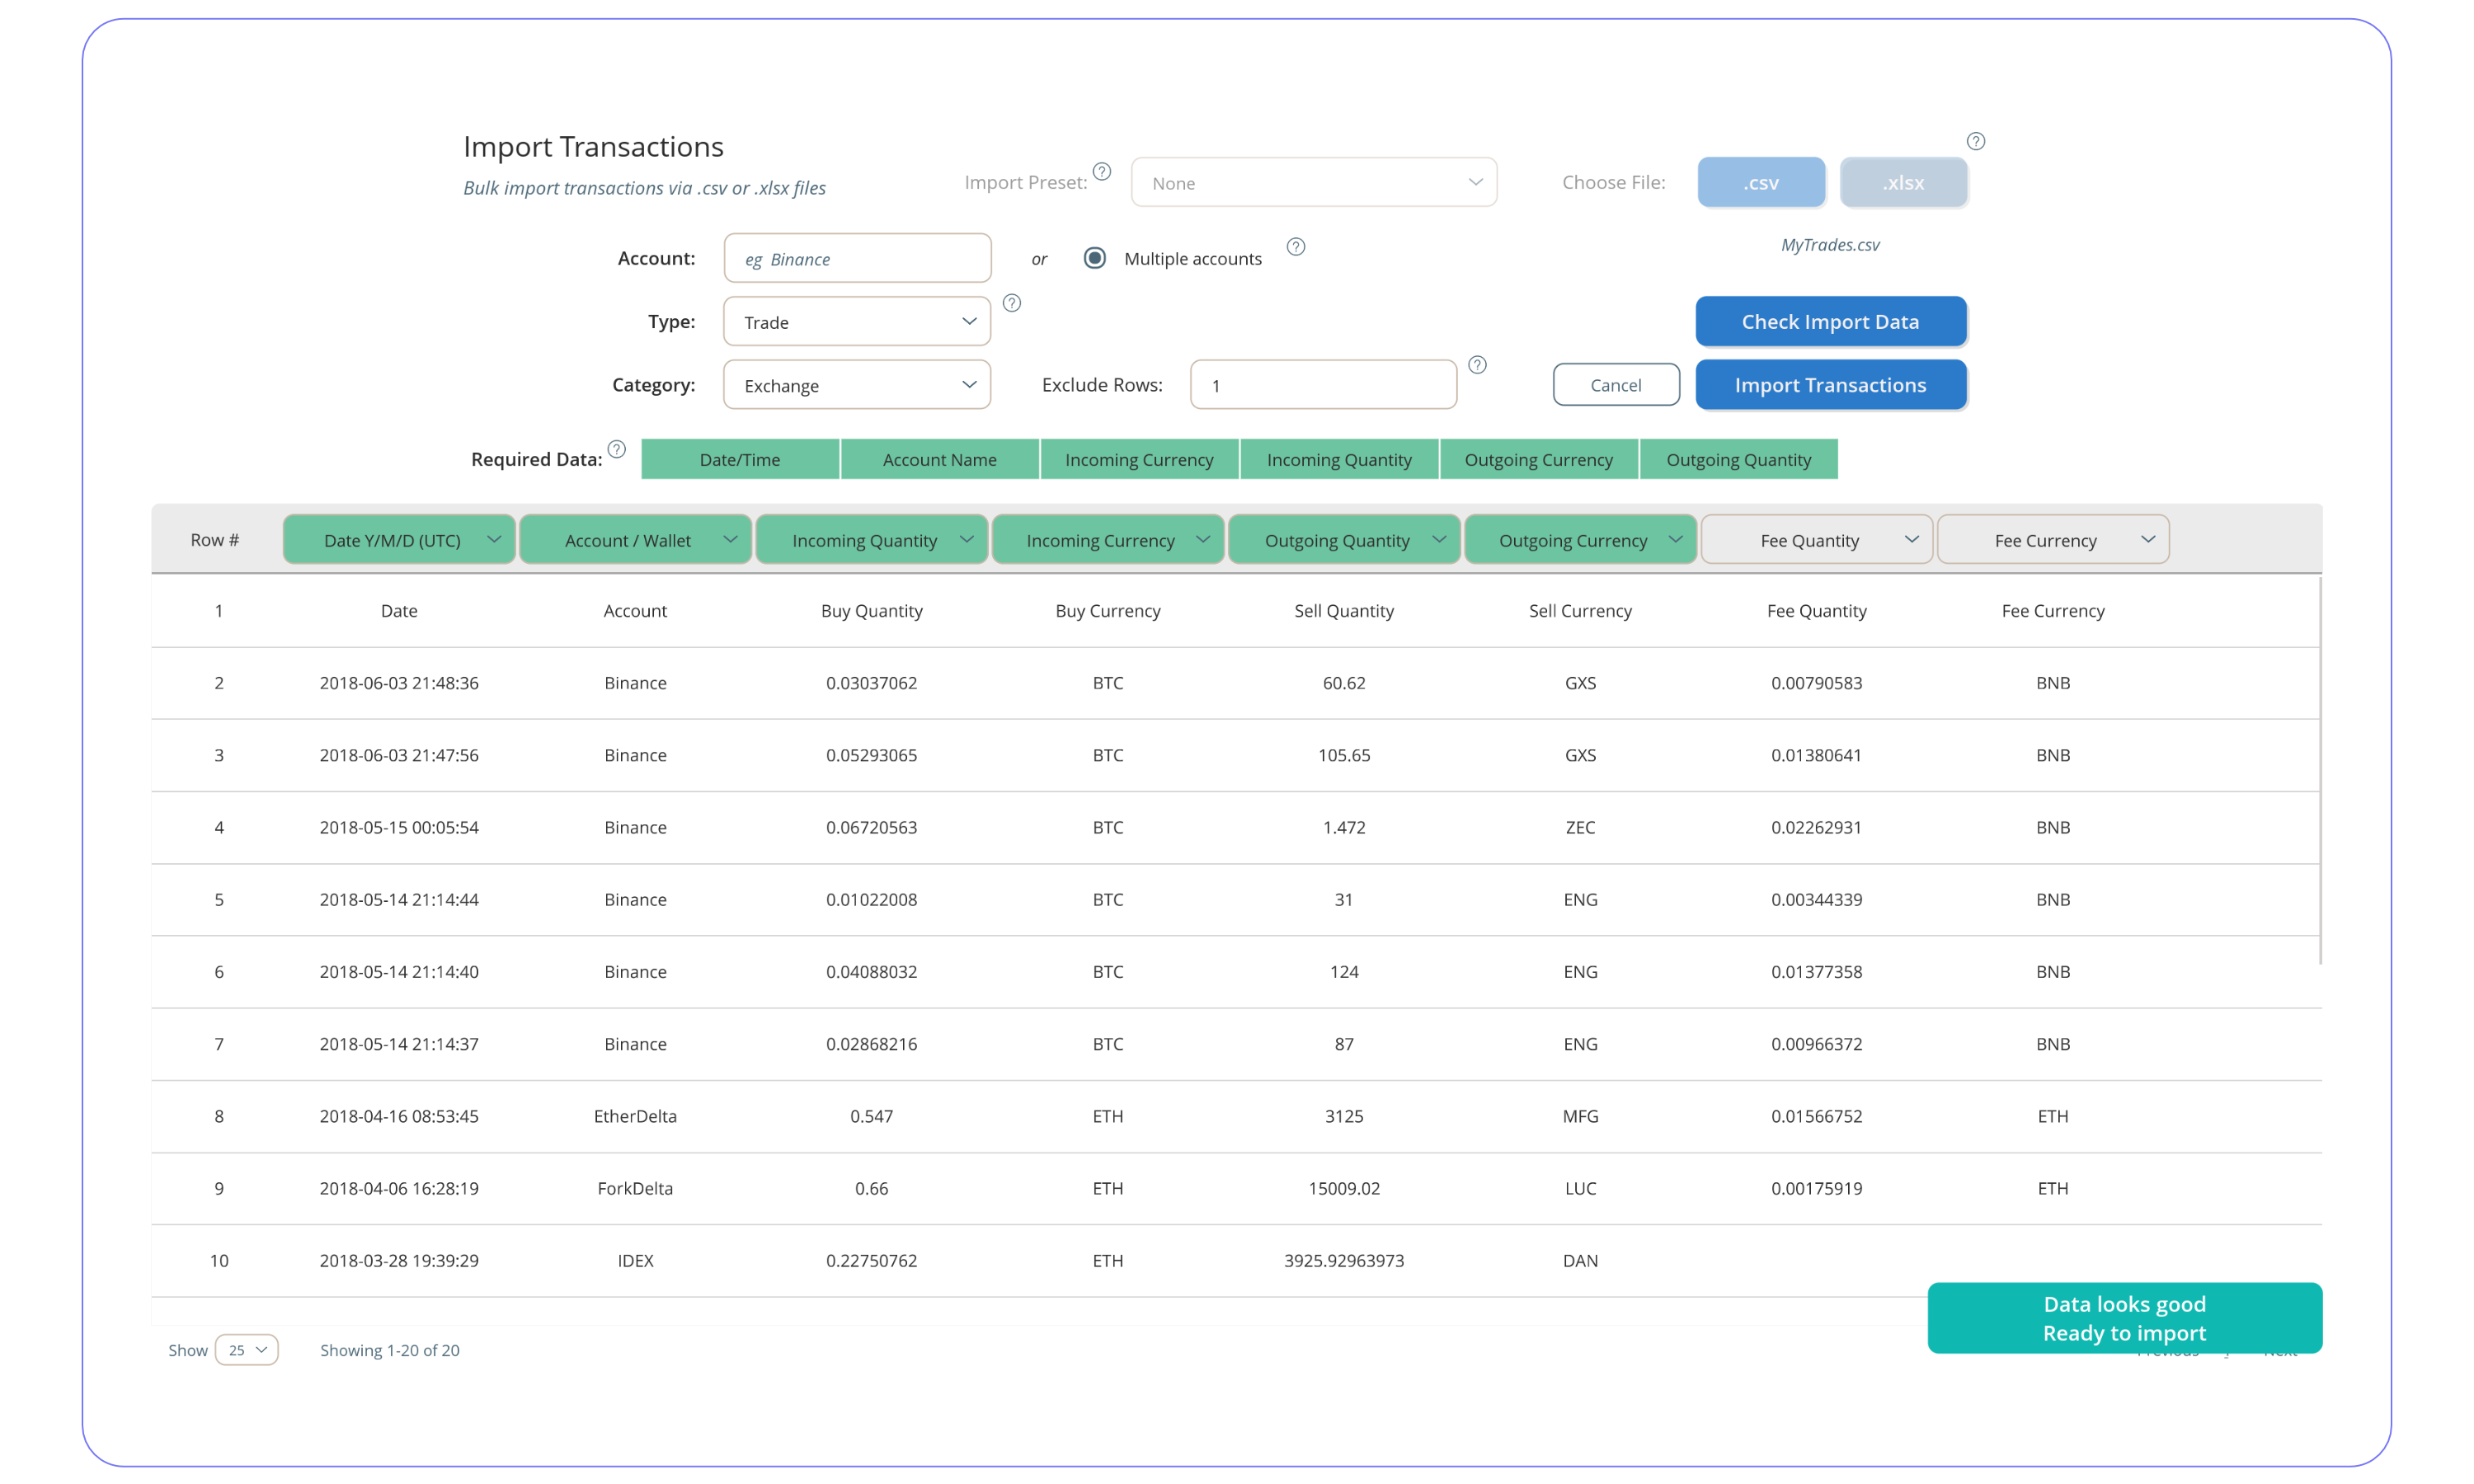
A generic importer is included in Moonie. After choosing your CSV file, Moonie will attempt to read the data and display it below the configuration UI.
Depending on the TYPE of transactions you are importing, a set of requirements will be shown. These columns must be assigned before you can start importing.
When all requirements are allocated (all GREEN), click Check Import Data. Moonie will check each allocated column for valid data. If all is good, you can
click Import Transactions and they will be added to your database.
Optionally allocate more columns. For example, you can add in Fees or maybe Trade IDs.
Add in any Row Numbers to exclude from the import. For example, Header or Footer rows.
03 - Edit Transactions
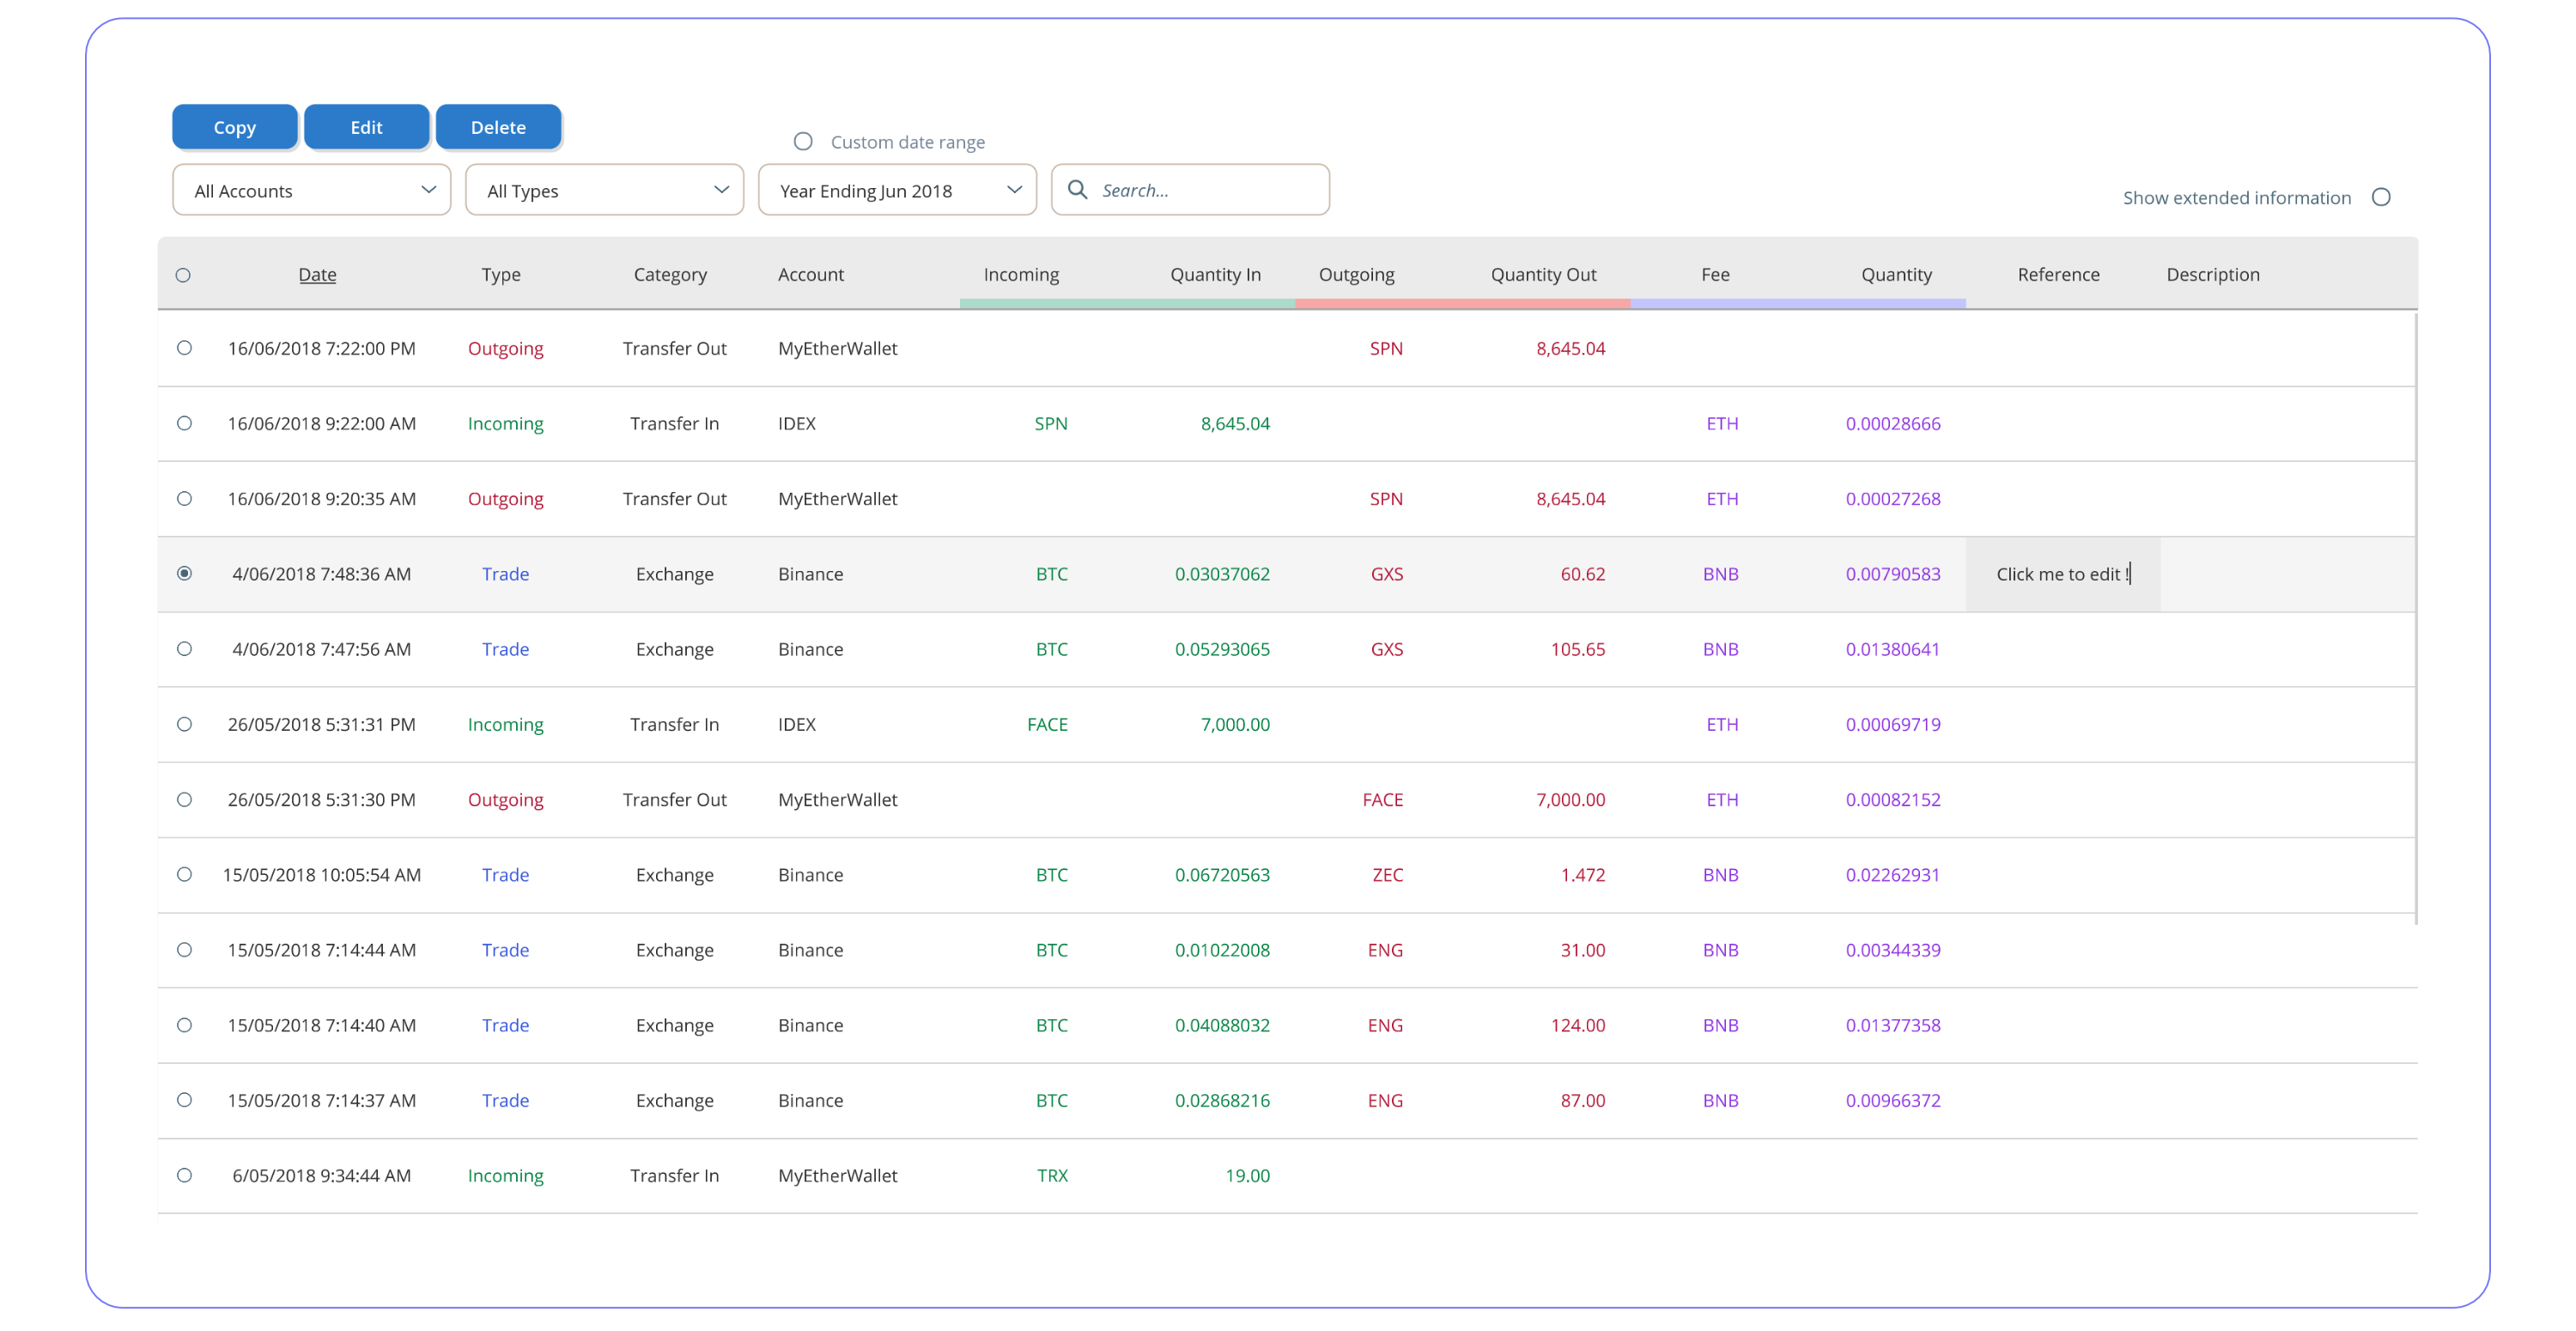
Transactions can be edited directly from the History table by clicking on a desired cell. Alternatively you can select an entire
row and click Edit above the table to open the transaction in a seperate window.
You can also Copy (duplicate) or Delete transactions from the History table.
Toggle Show Extended Info to show the transactions in more detail.
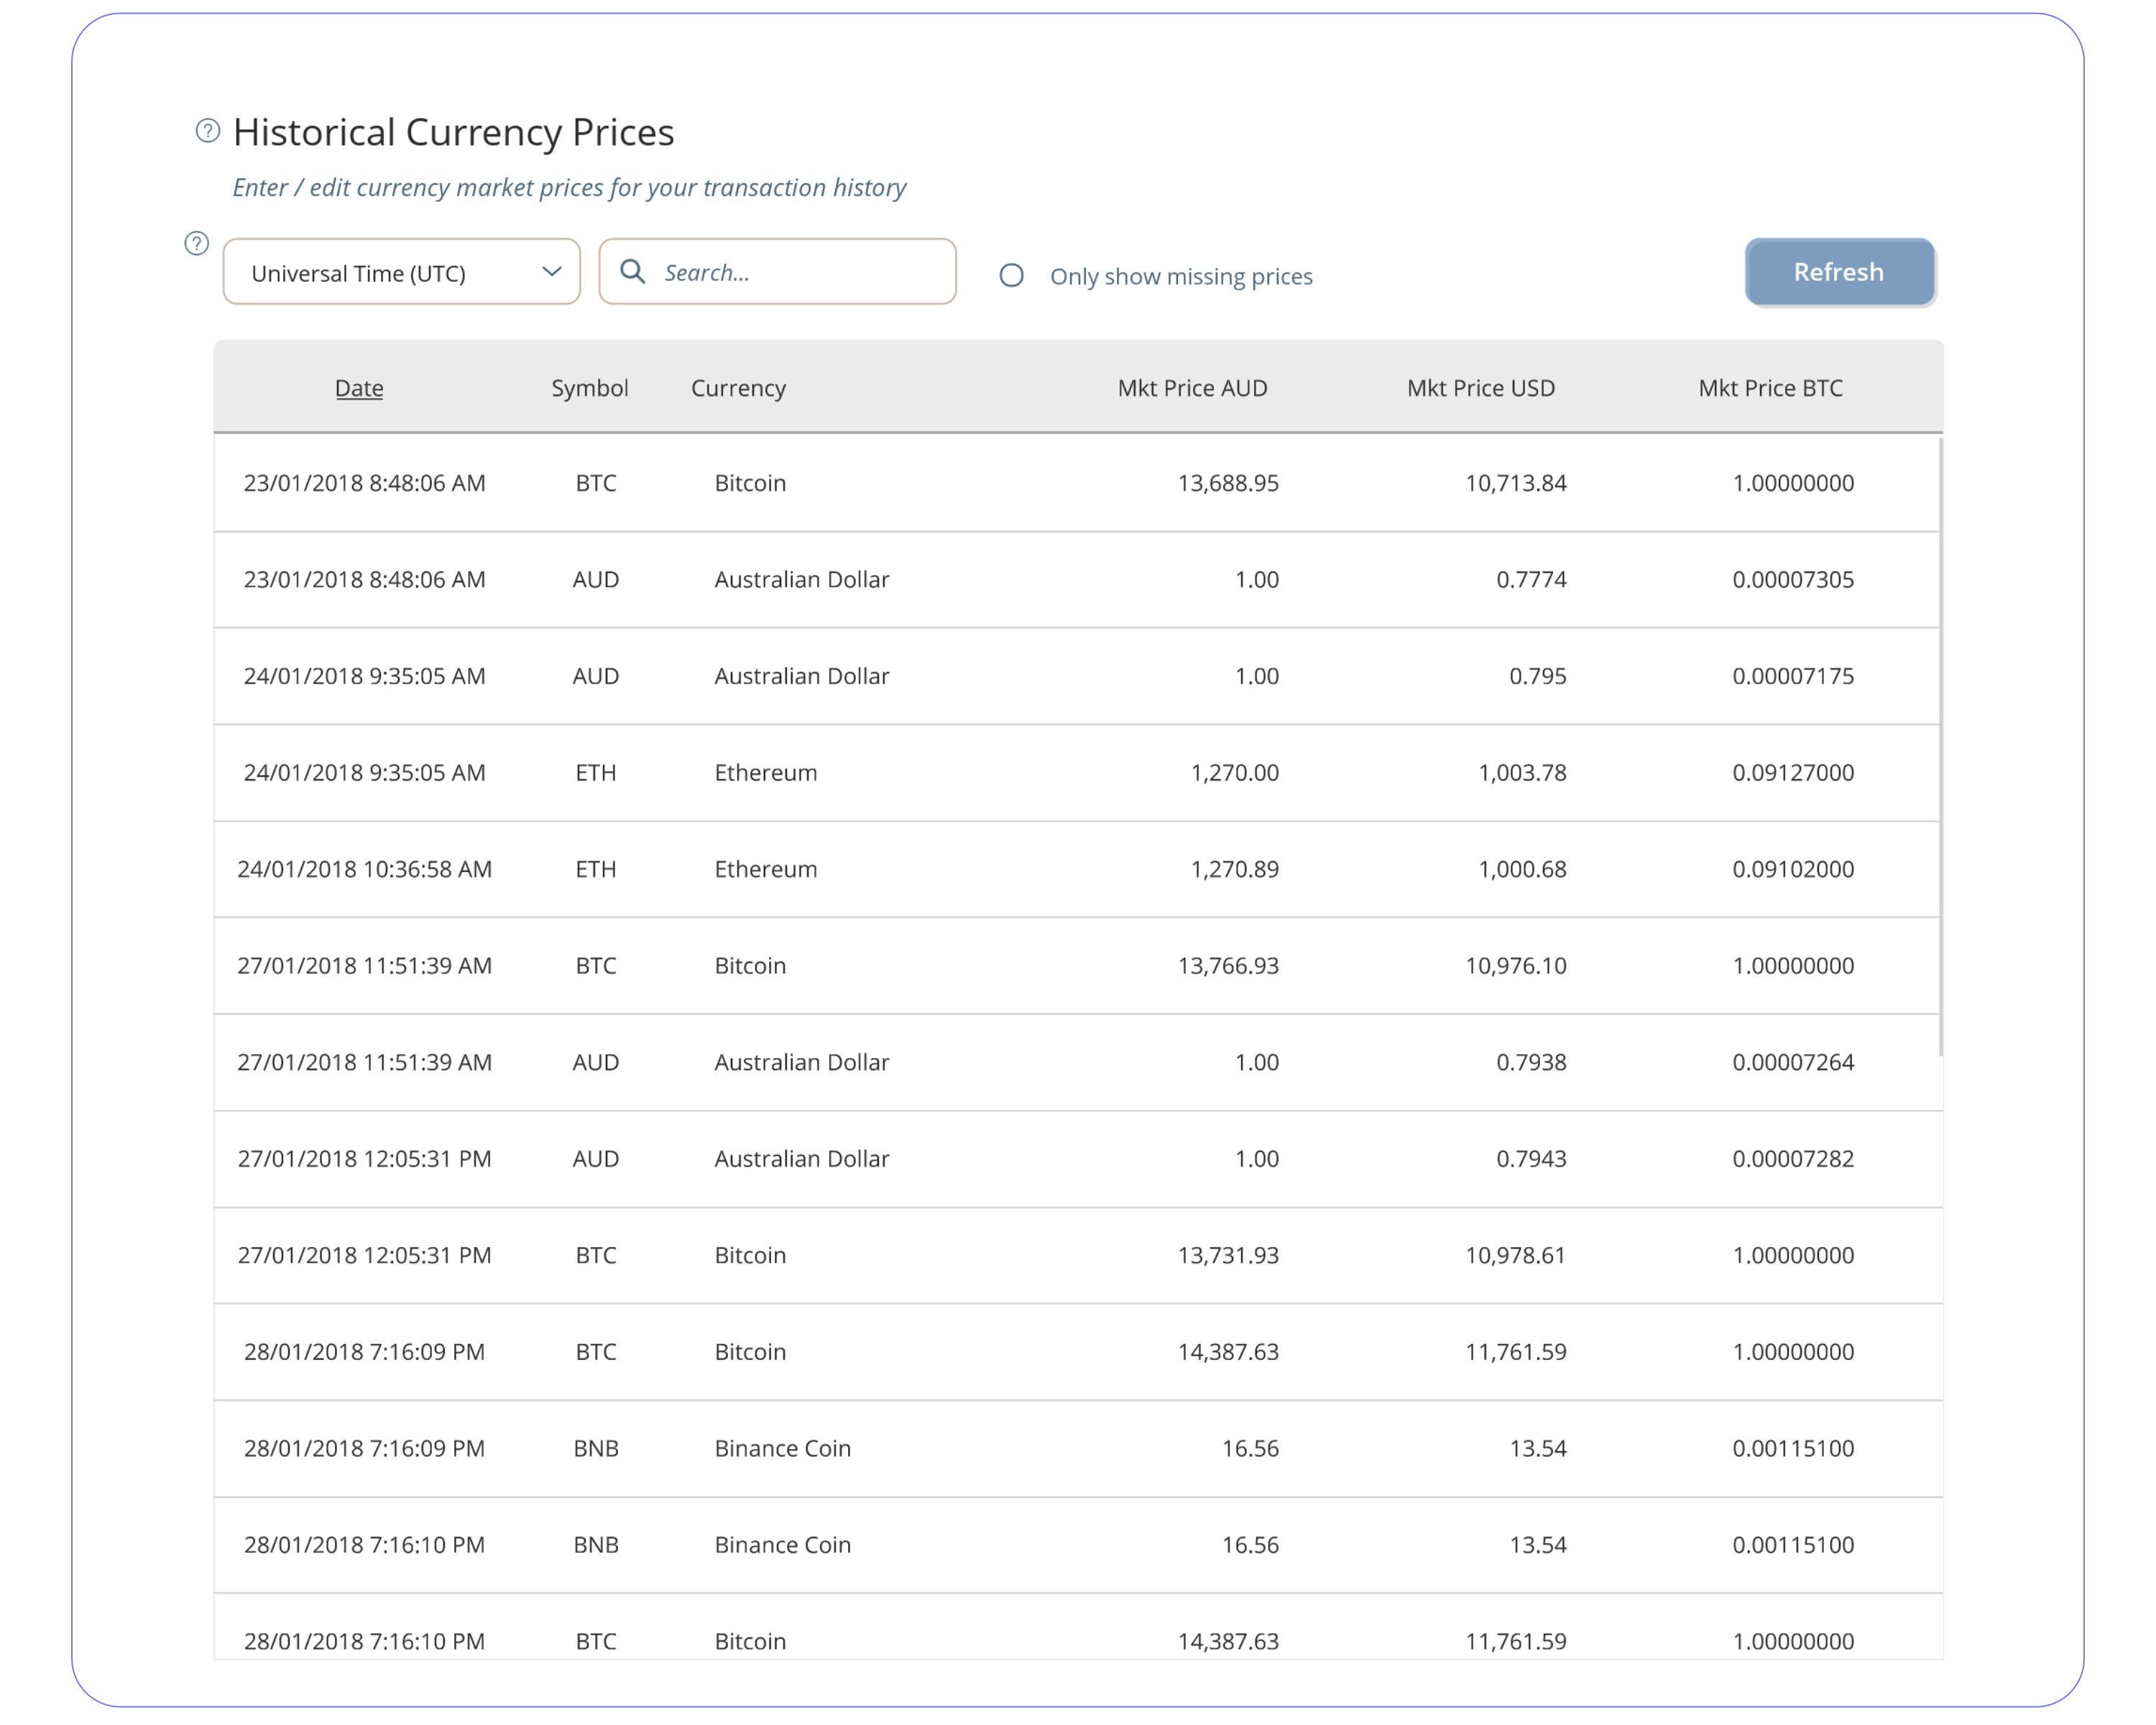
A dedicated tab has been created for your historical prices. Any transactions with missing currency prices will automatically show up here. You can enter or edit any of your stored prices via this tab.
04 - Dashboard
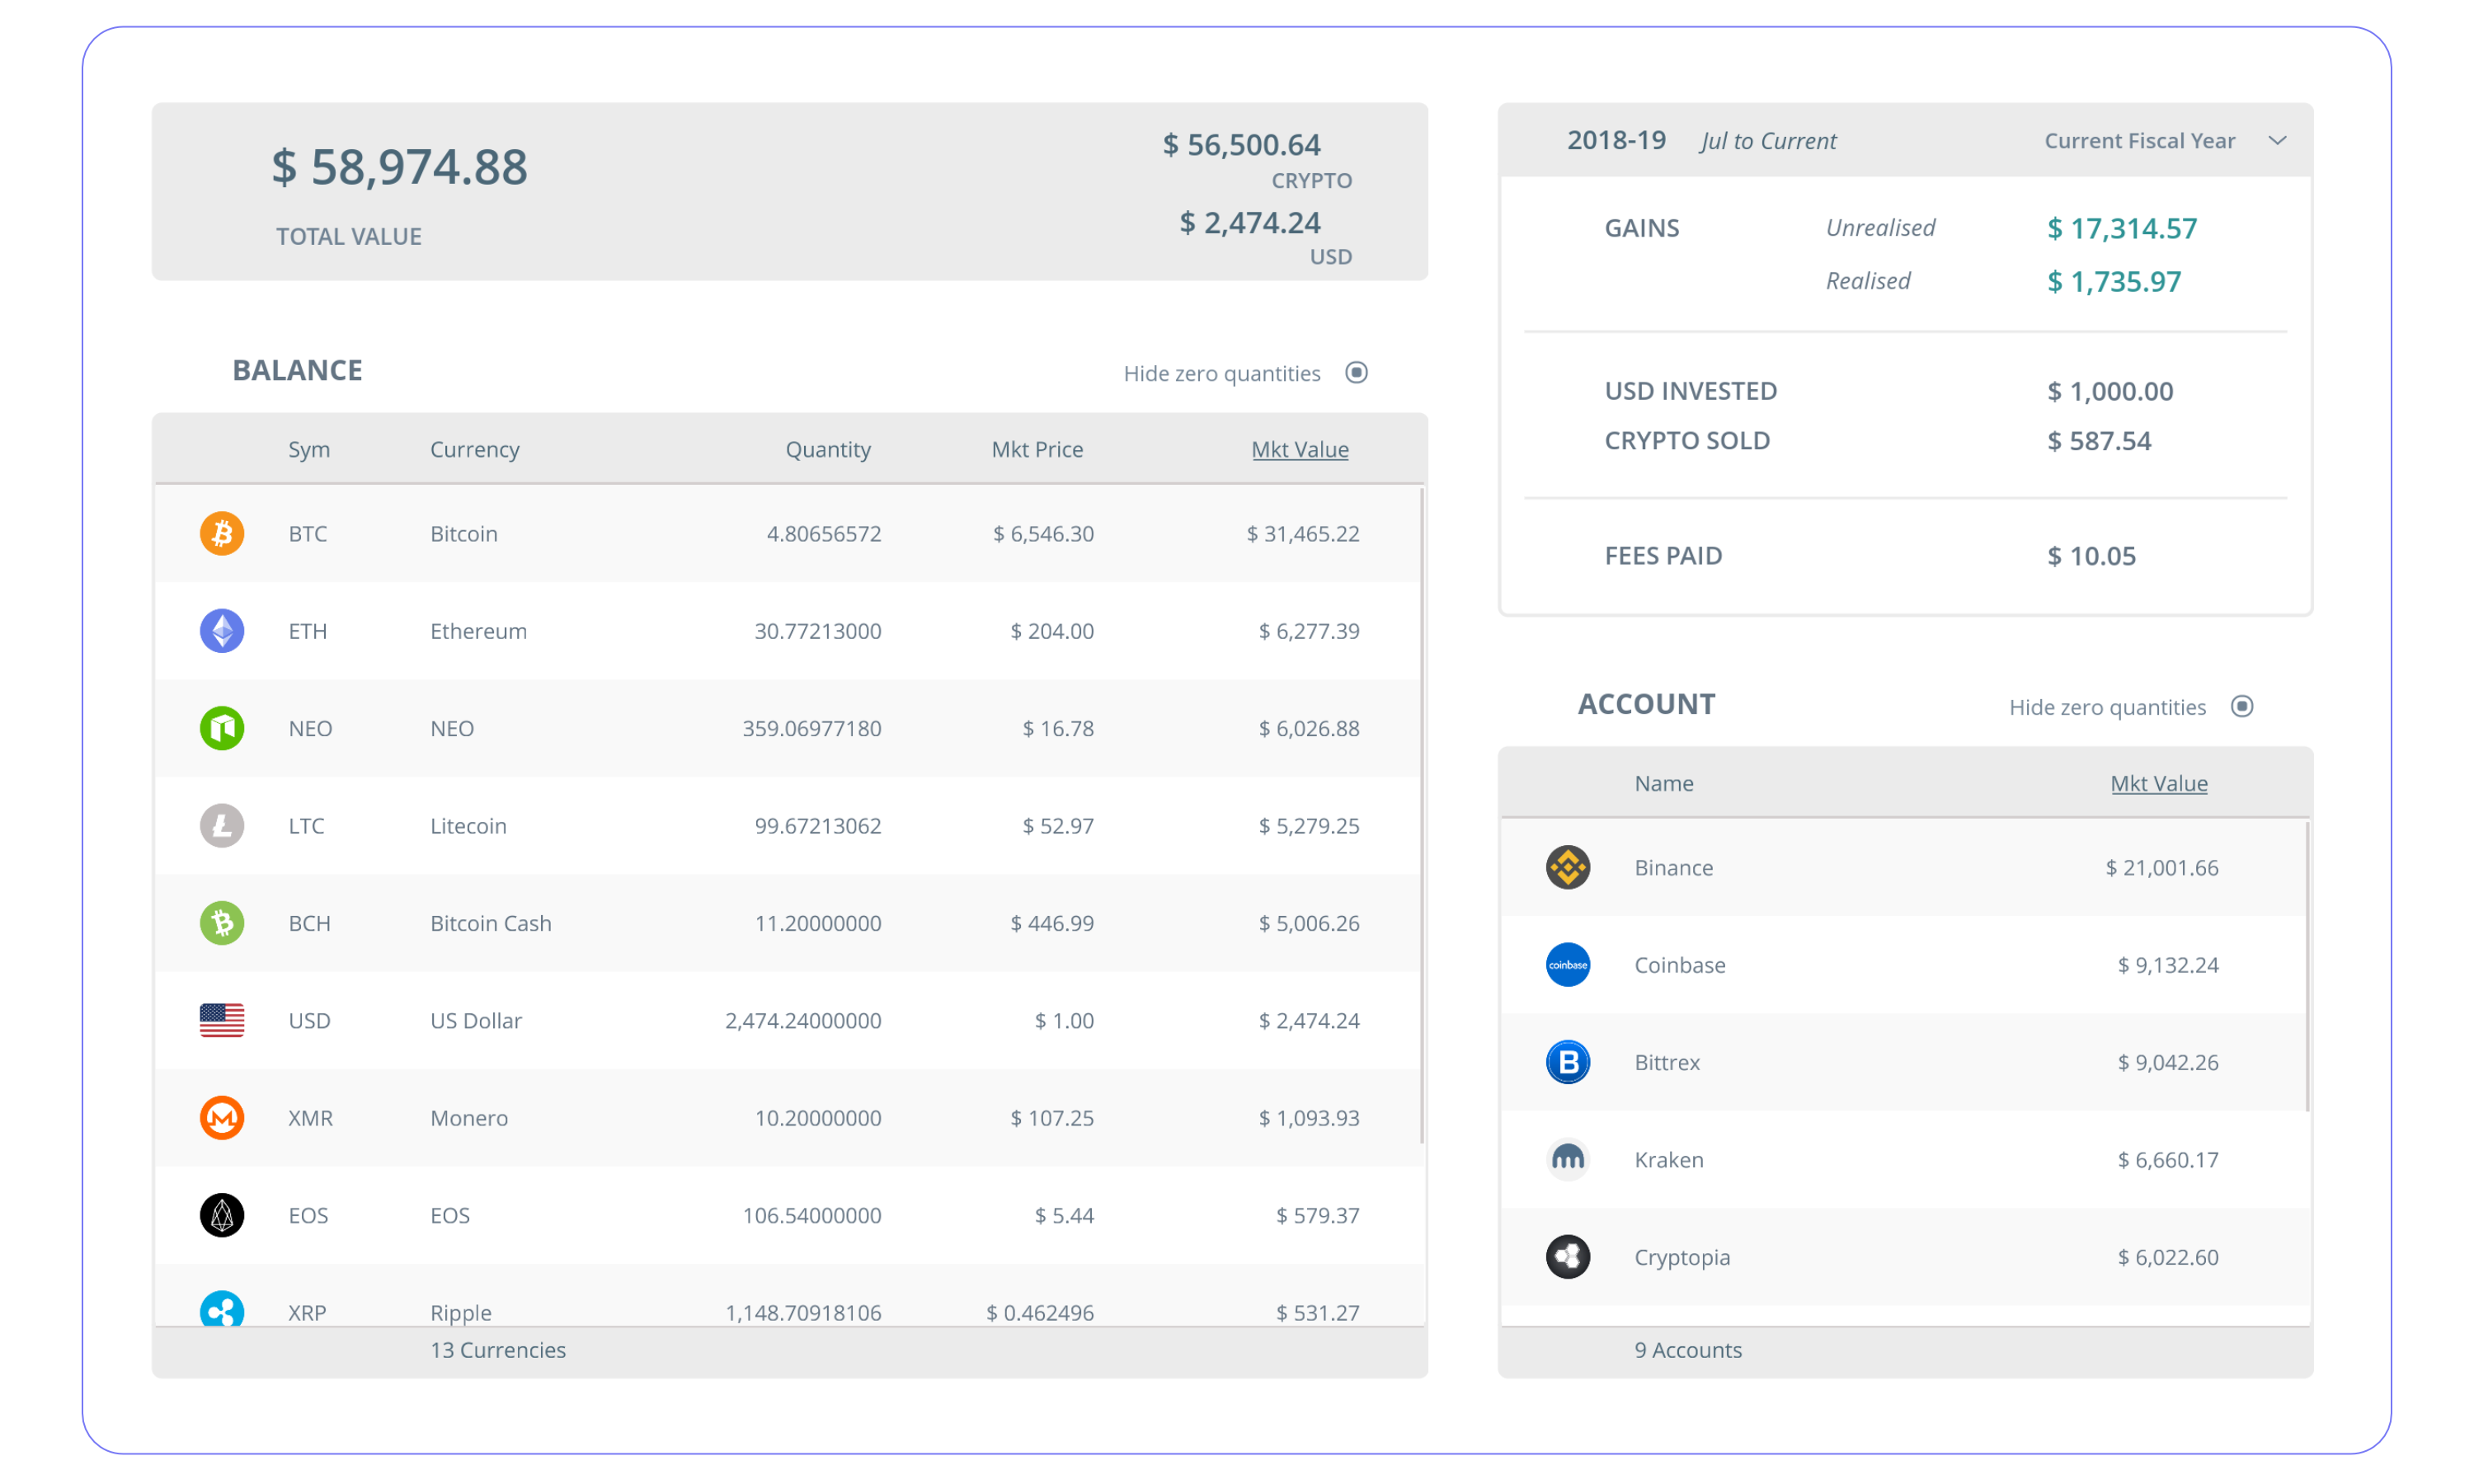
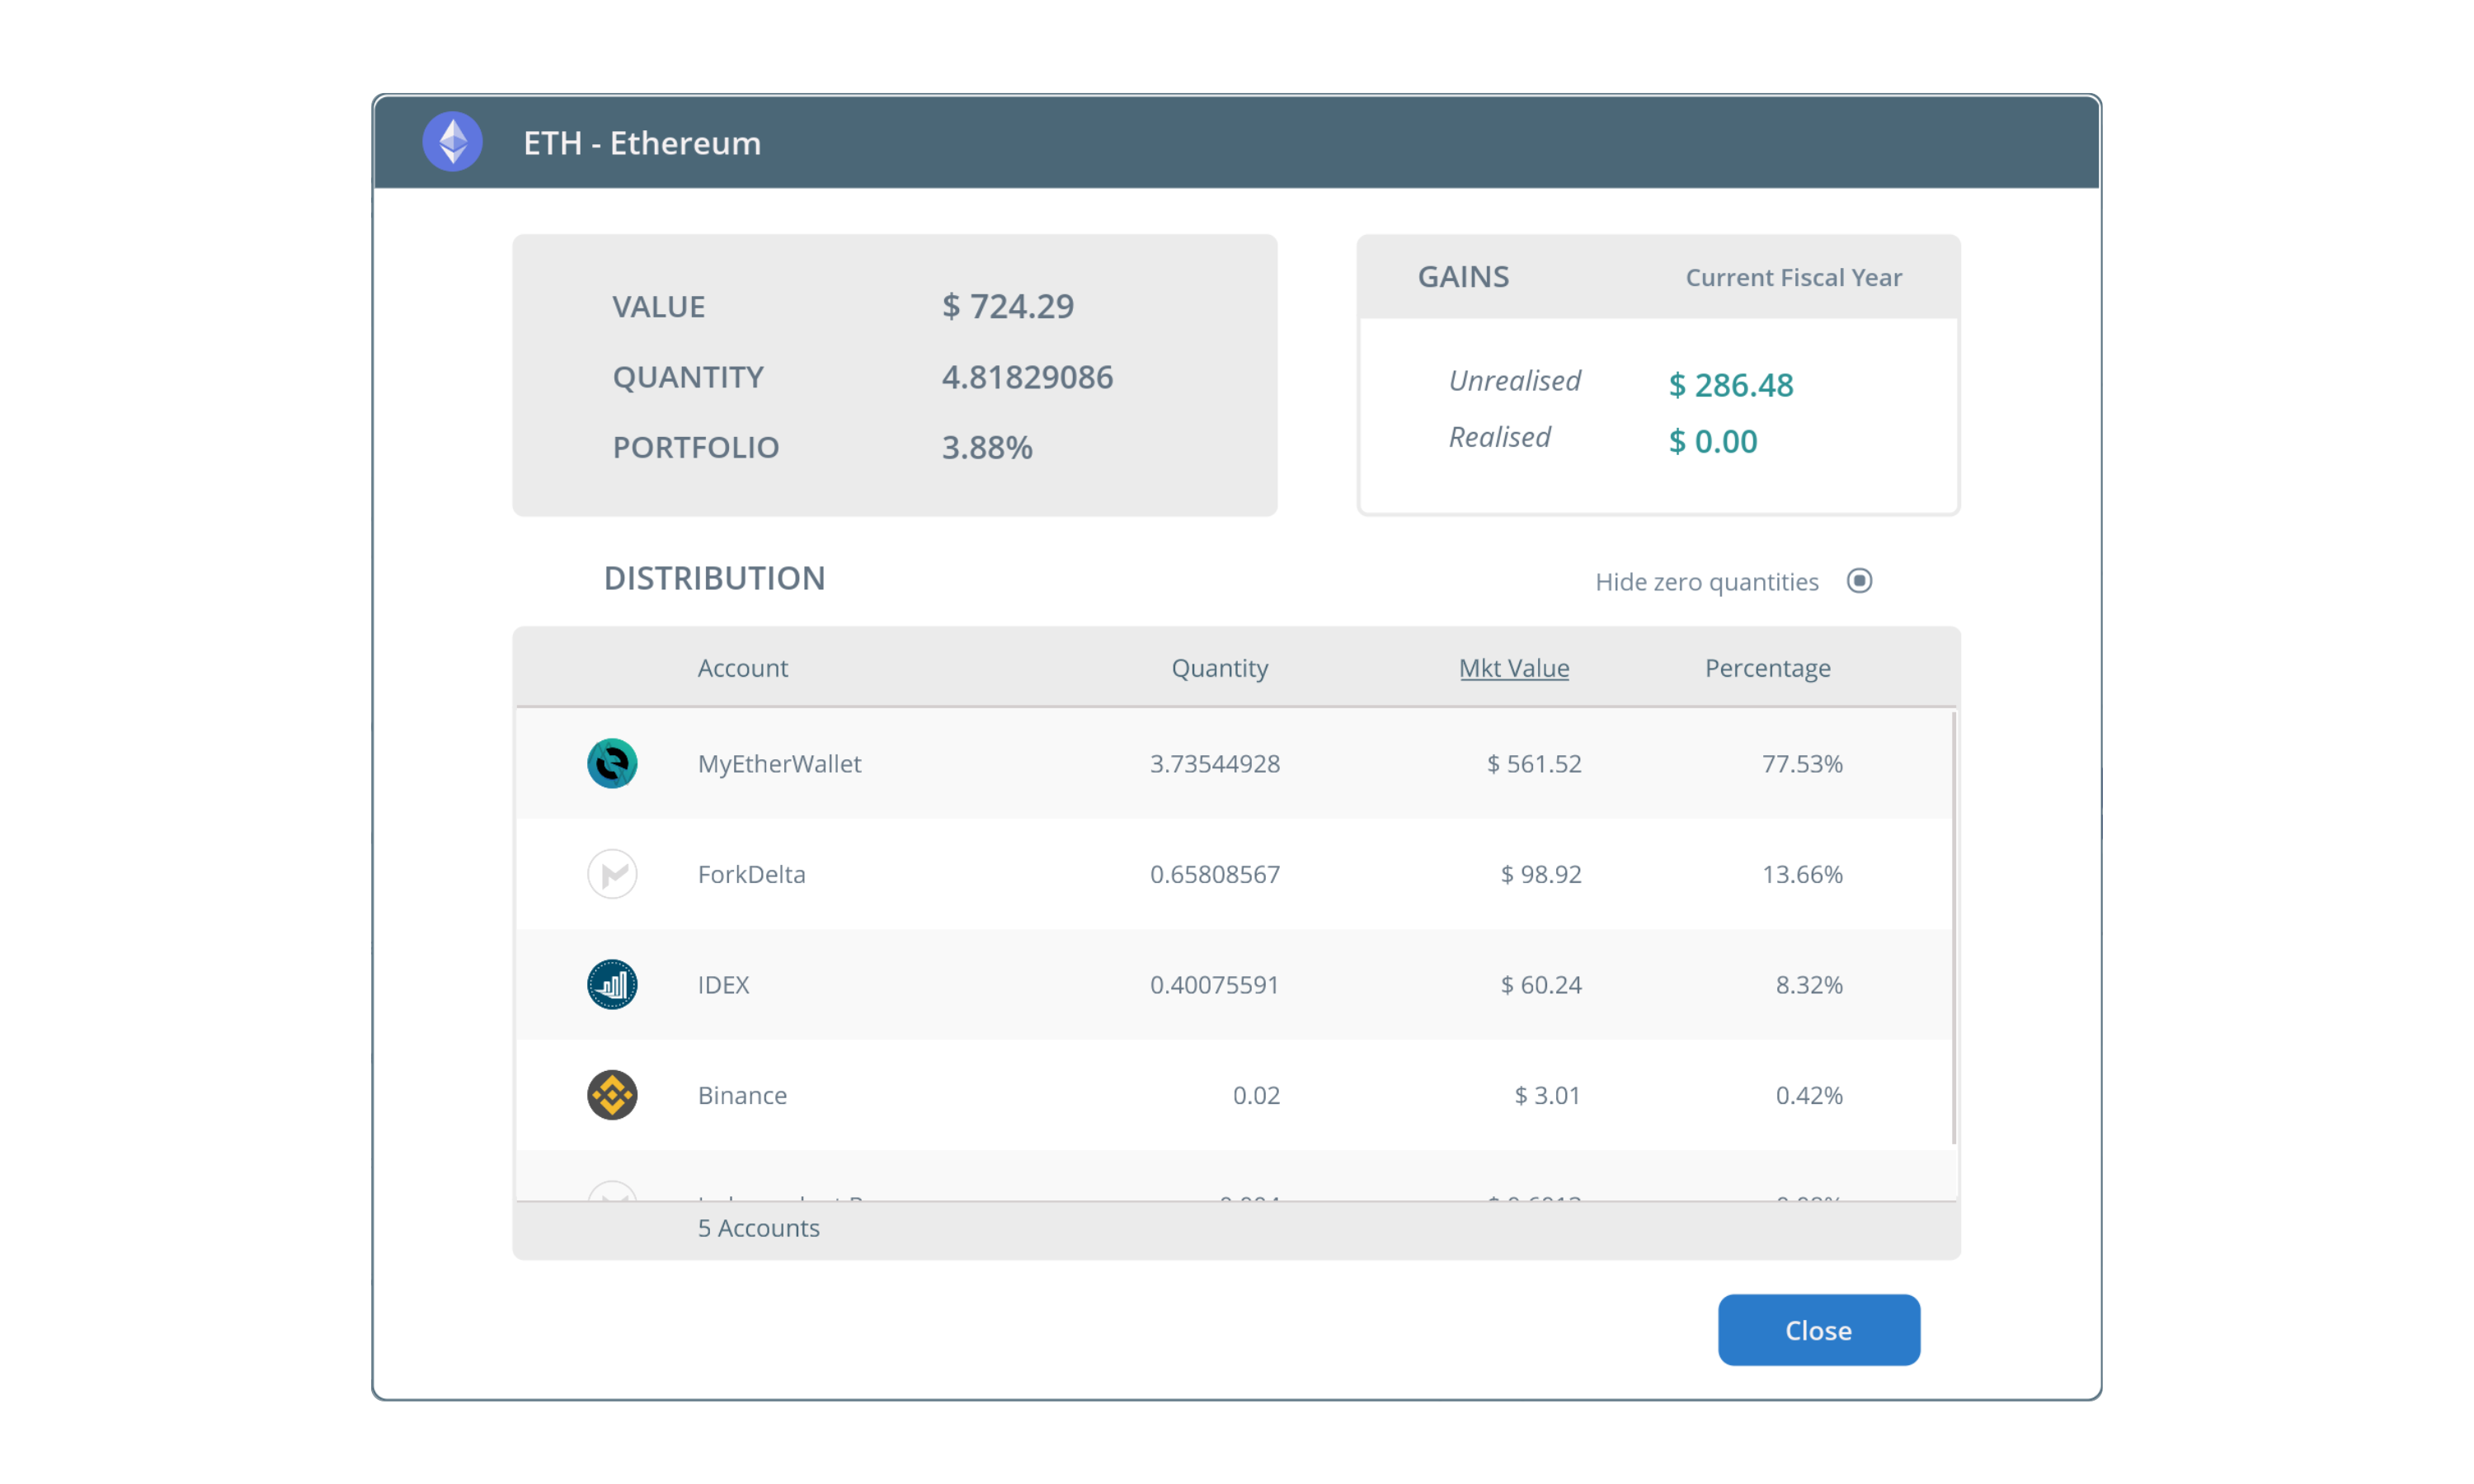
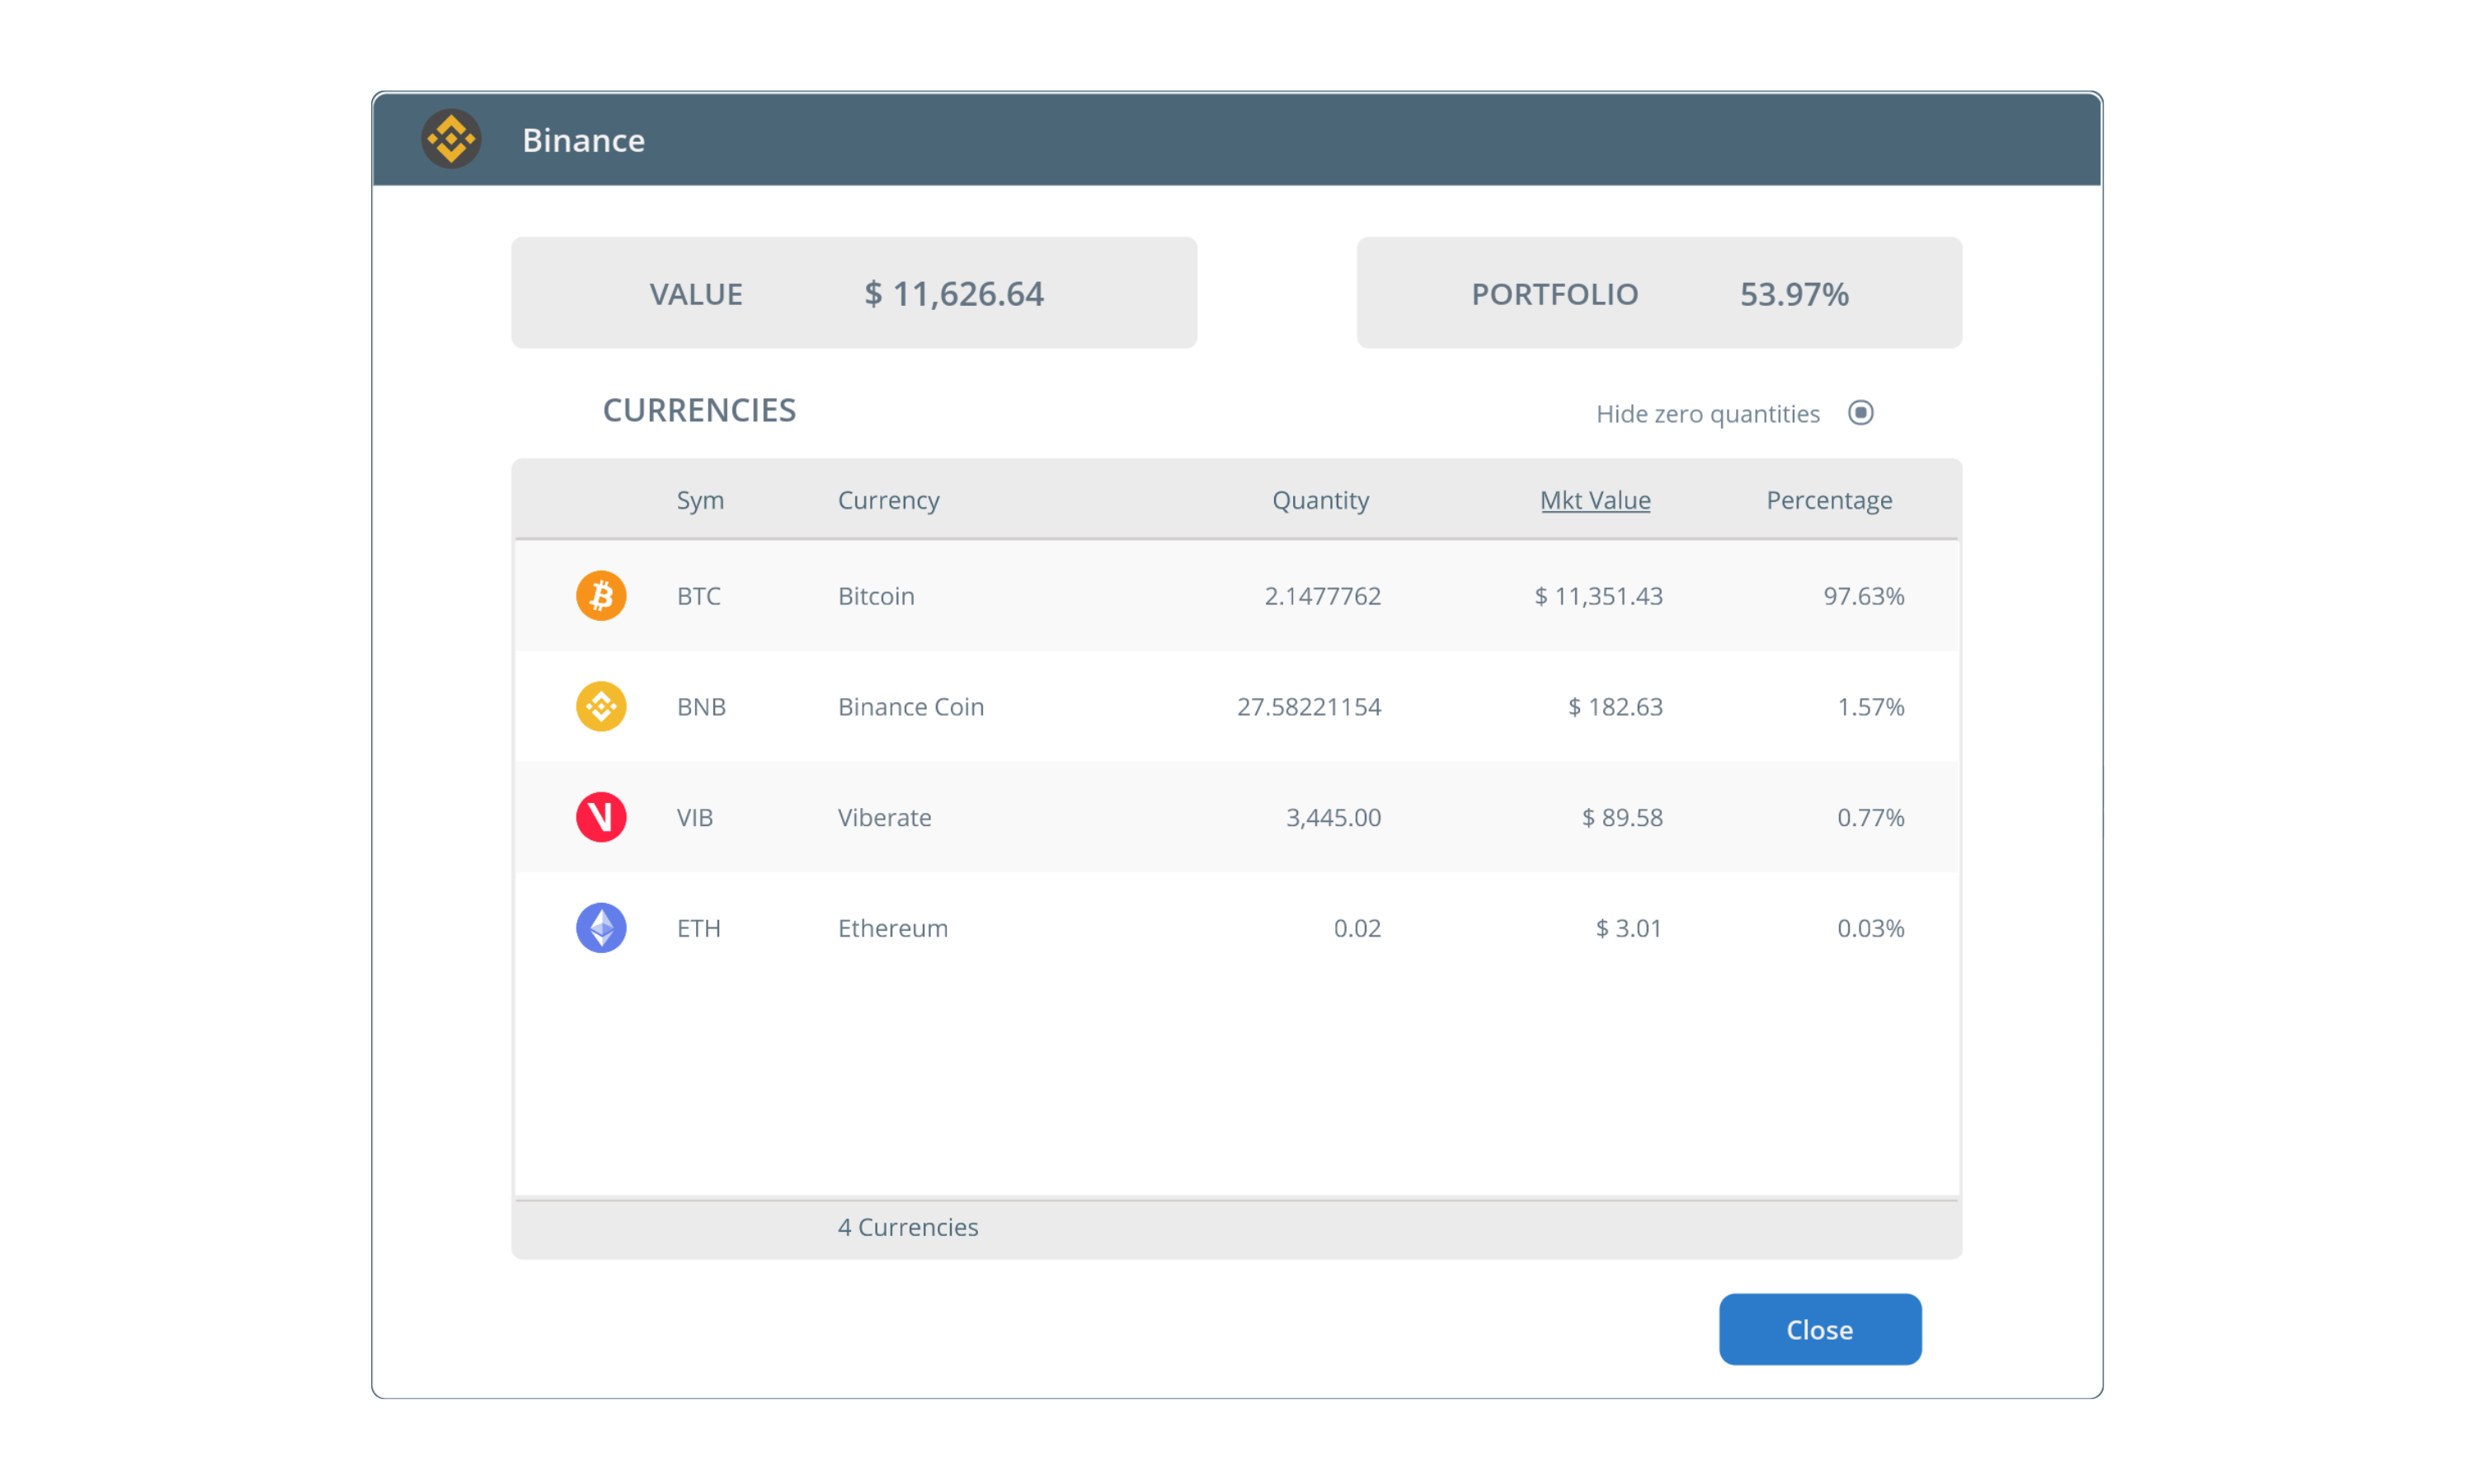
The dashboard displays a current overview of your portfolio and trading activity. Everything here should be self explanatory. Clicking a row in either the Balance or Account table will show a more in-depth analysis of your holdings distribution. Prices shown here are fetched from various exchanges online and used to generate current estimated values of your holdings.
05 - Reports
The Reports tab offers a variety of ways to breakdown your data. Reports can be generated showing values in any one of your
included currencies (eg USD or BTC valuations).
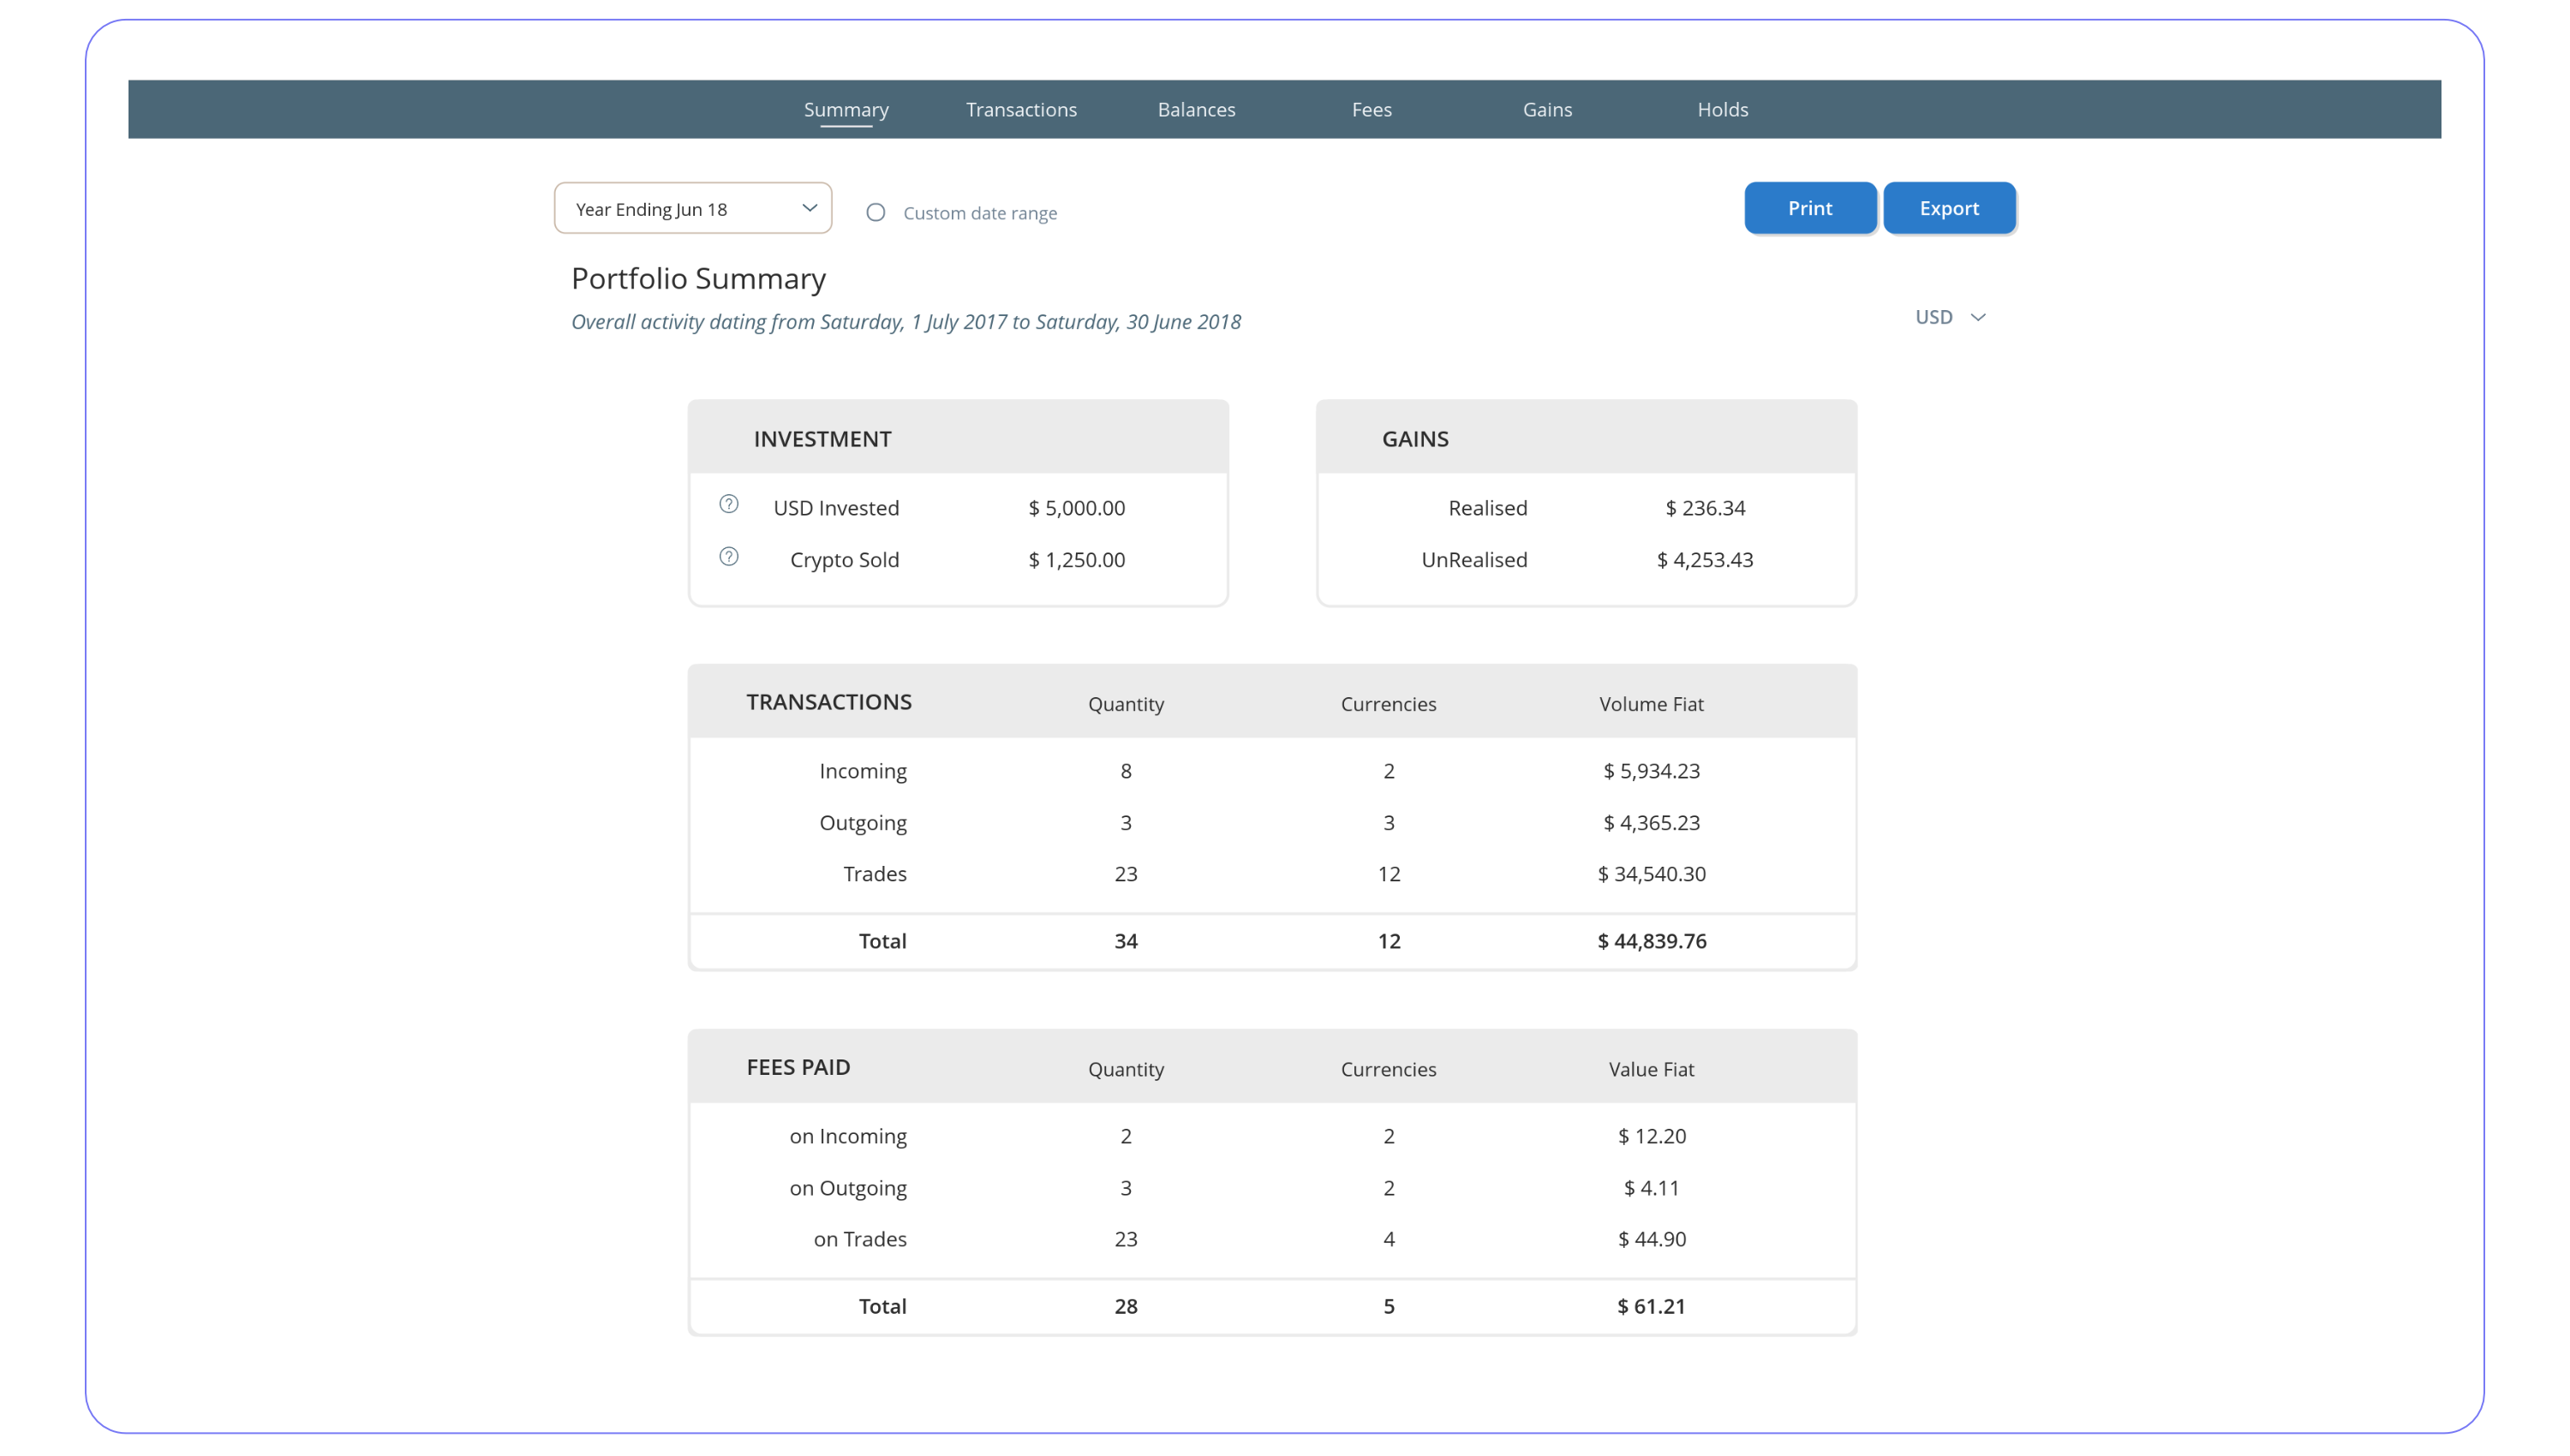
Summary shows fiat (eg USD) invested/cashed out, un/realised gains, transactions made and fees paid for the selected fiscal year/custom time period.
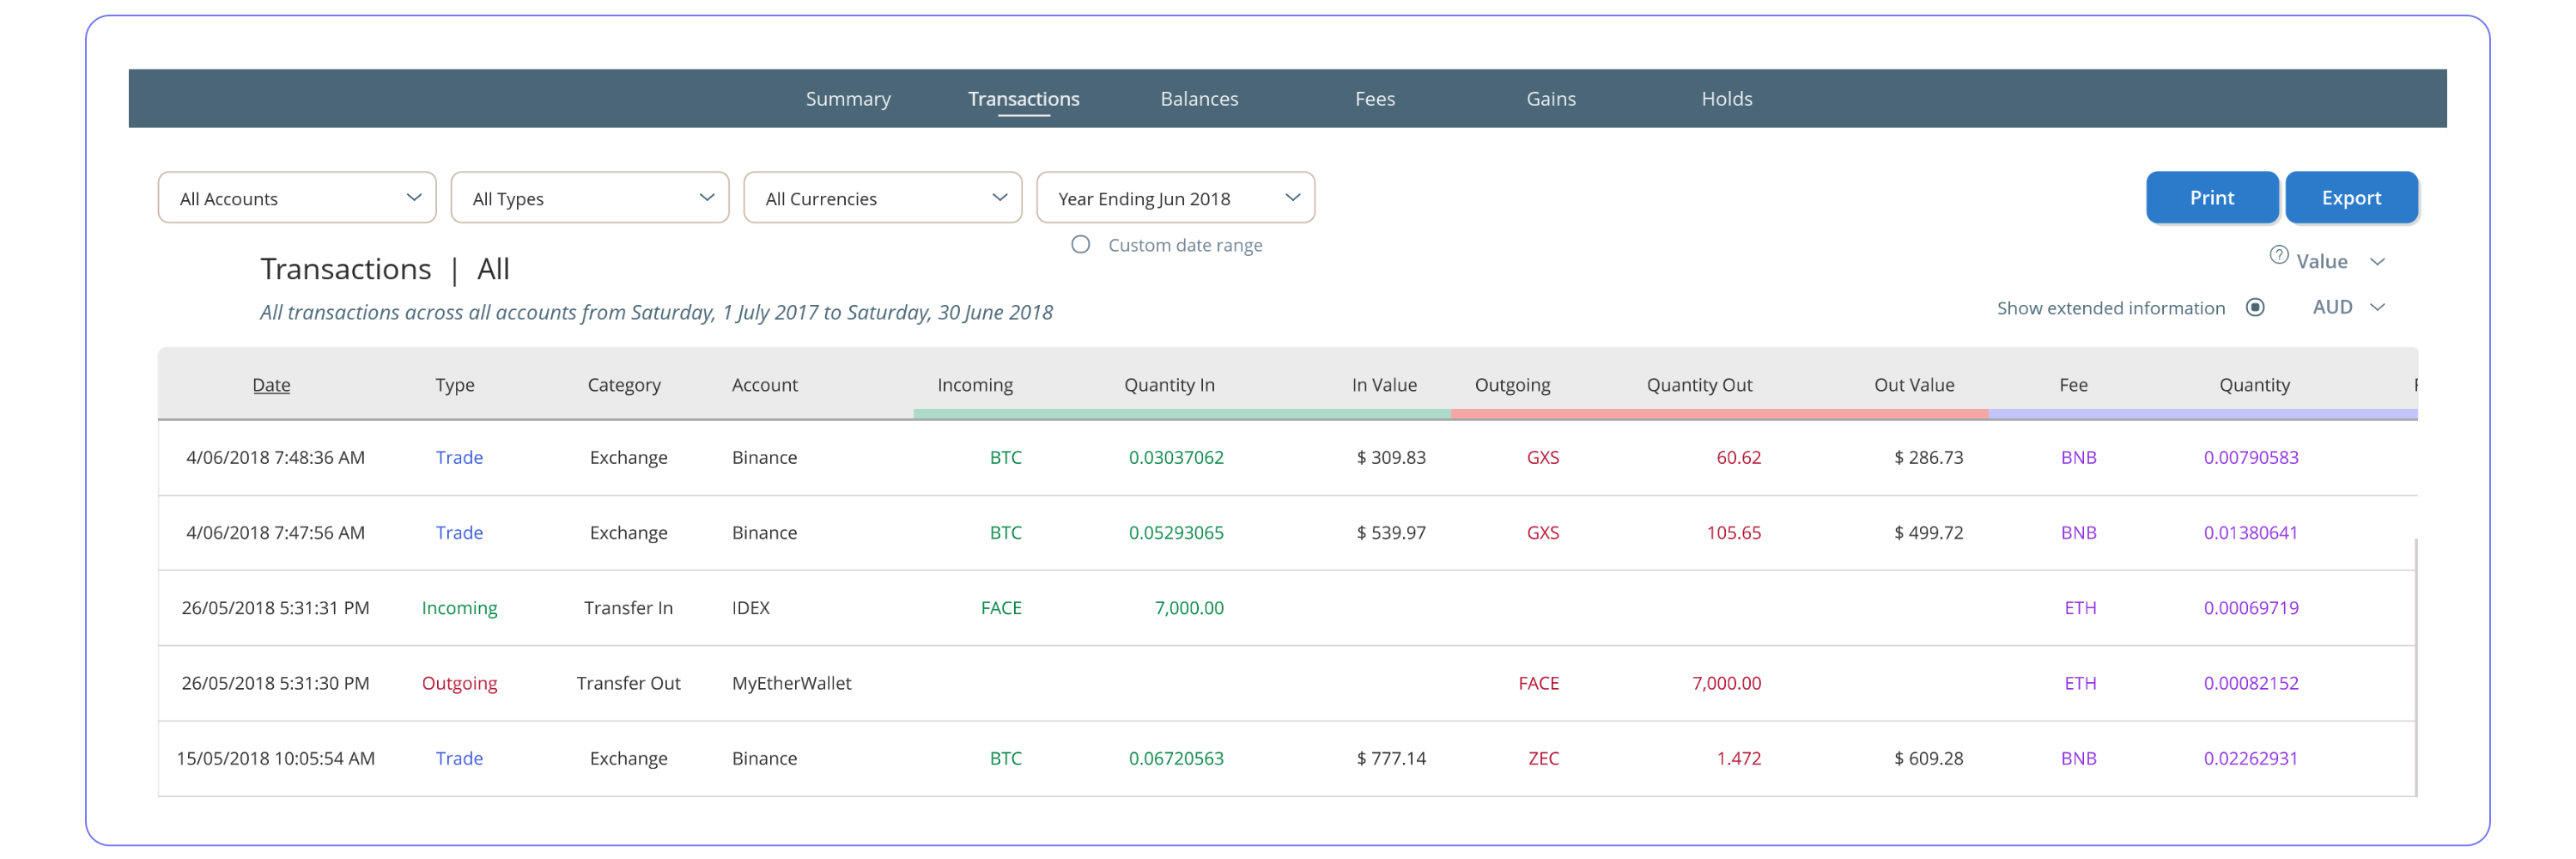
Transactions is the same as your History table with the added option of displaying Currency Prices or Transacted Values.
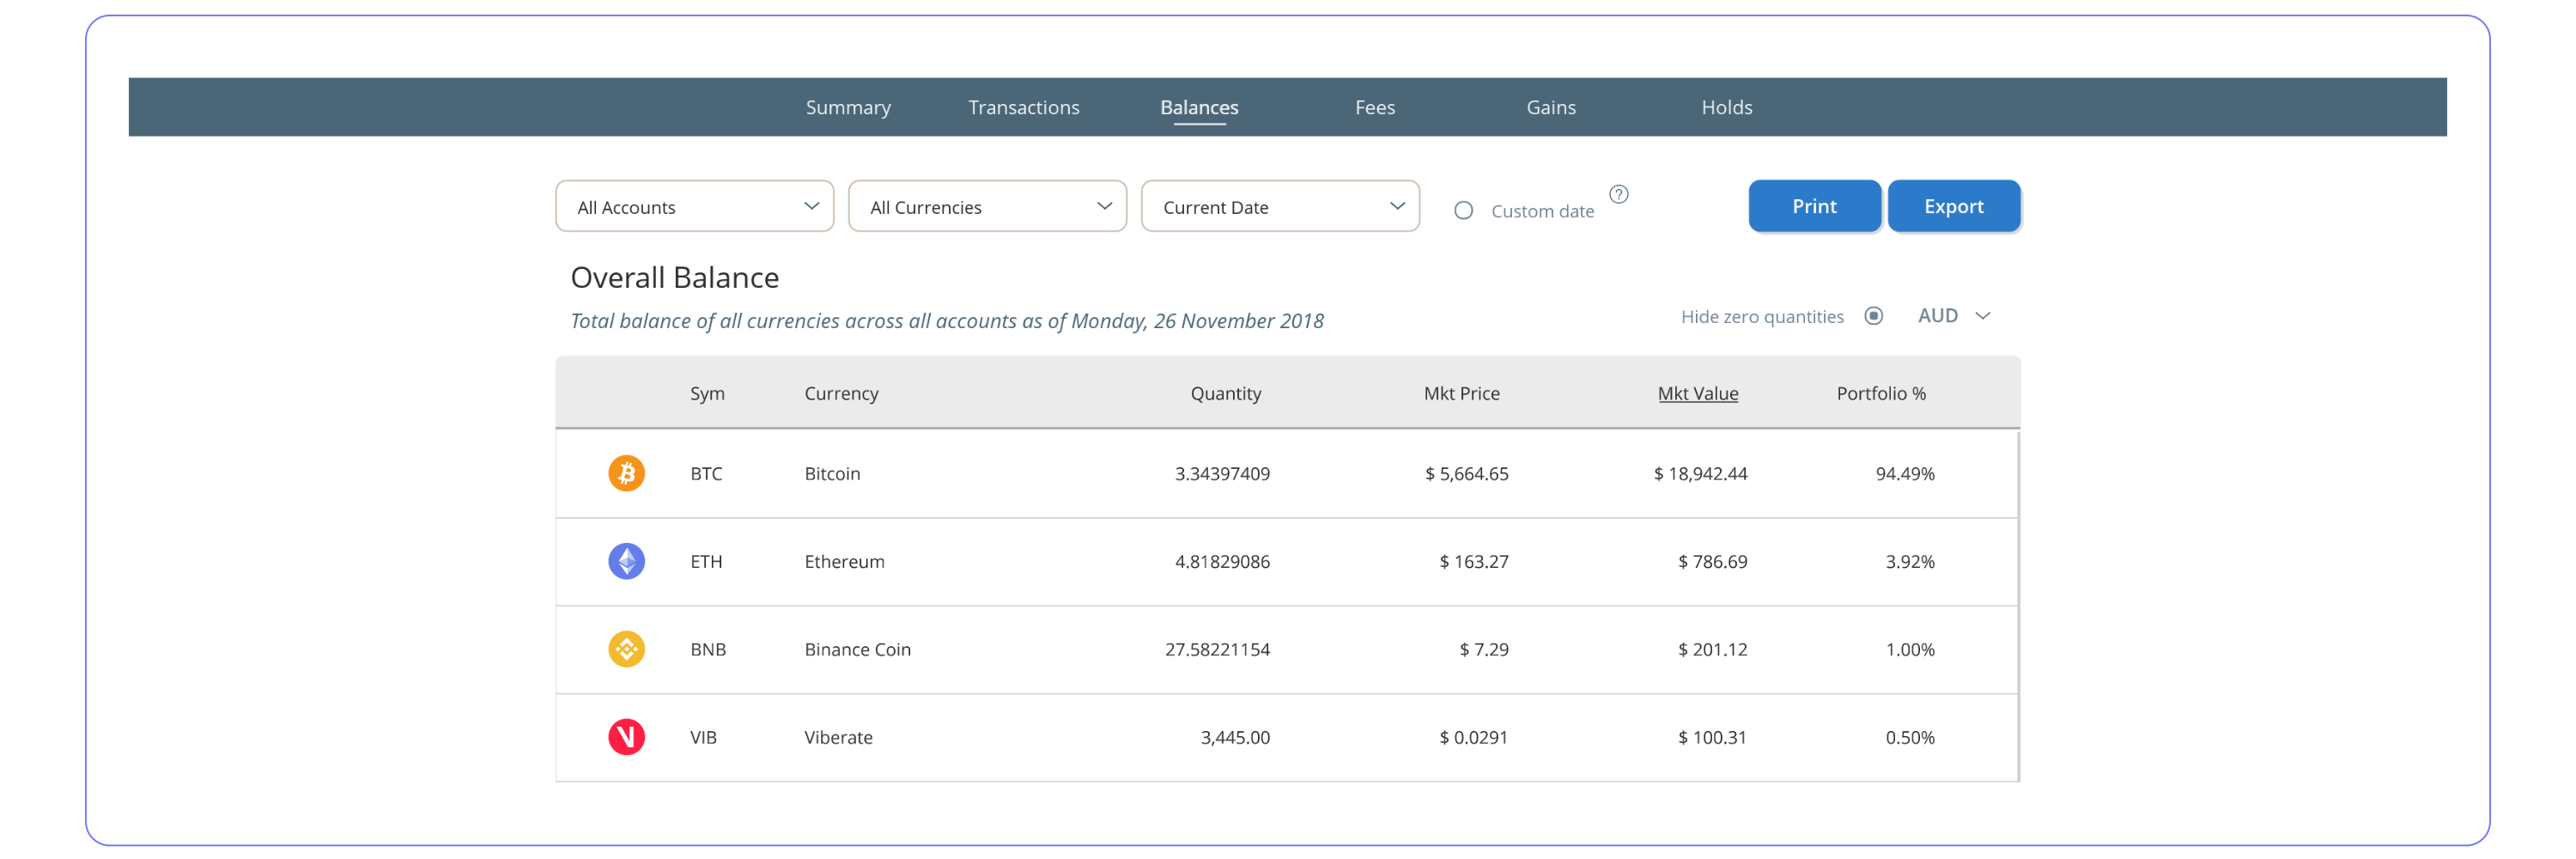
Balances shows holdings at any custom date. However, prices/values are only shown for the current date or end of fiscal year dates.
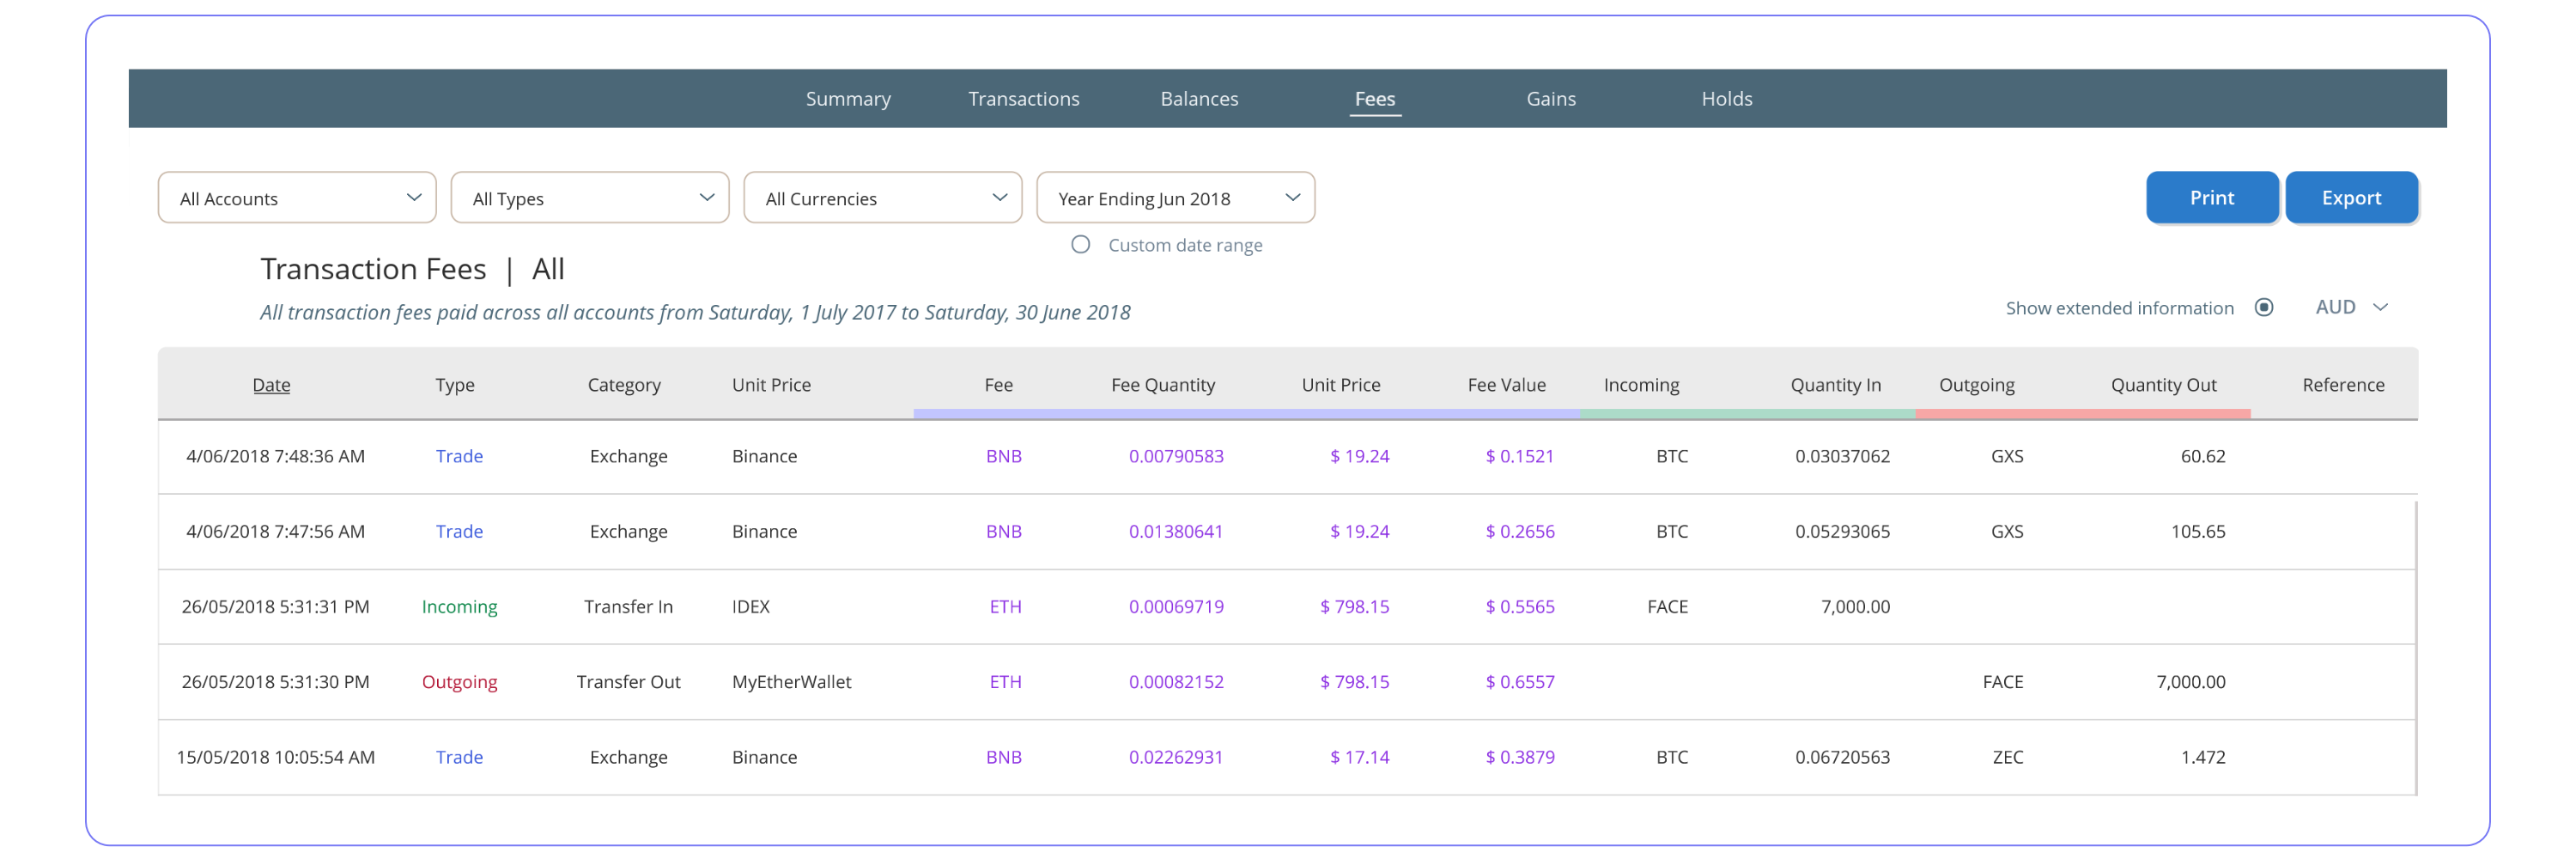
Fees shows transactions that incurred a fee along with their valuations.
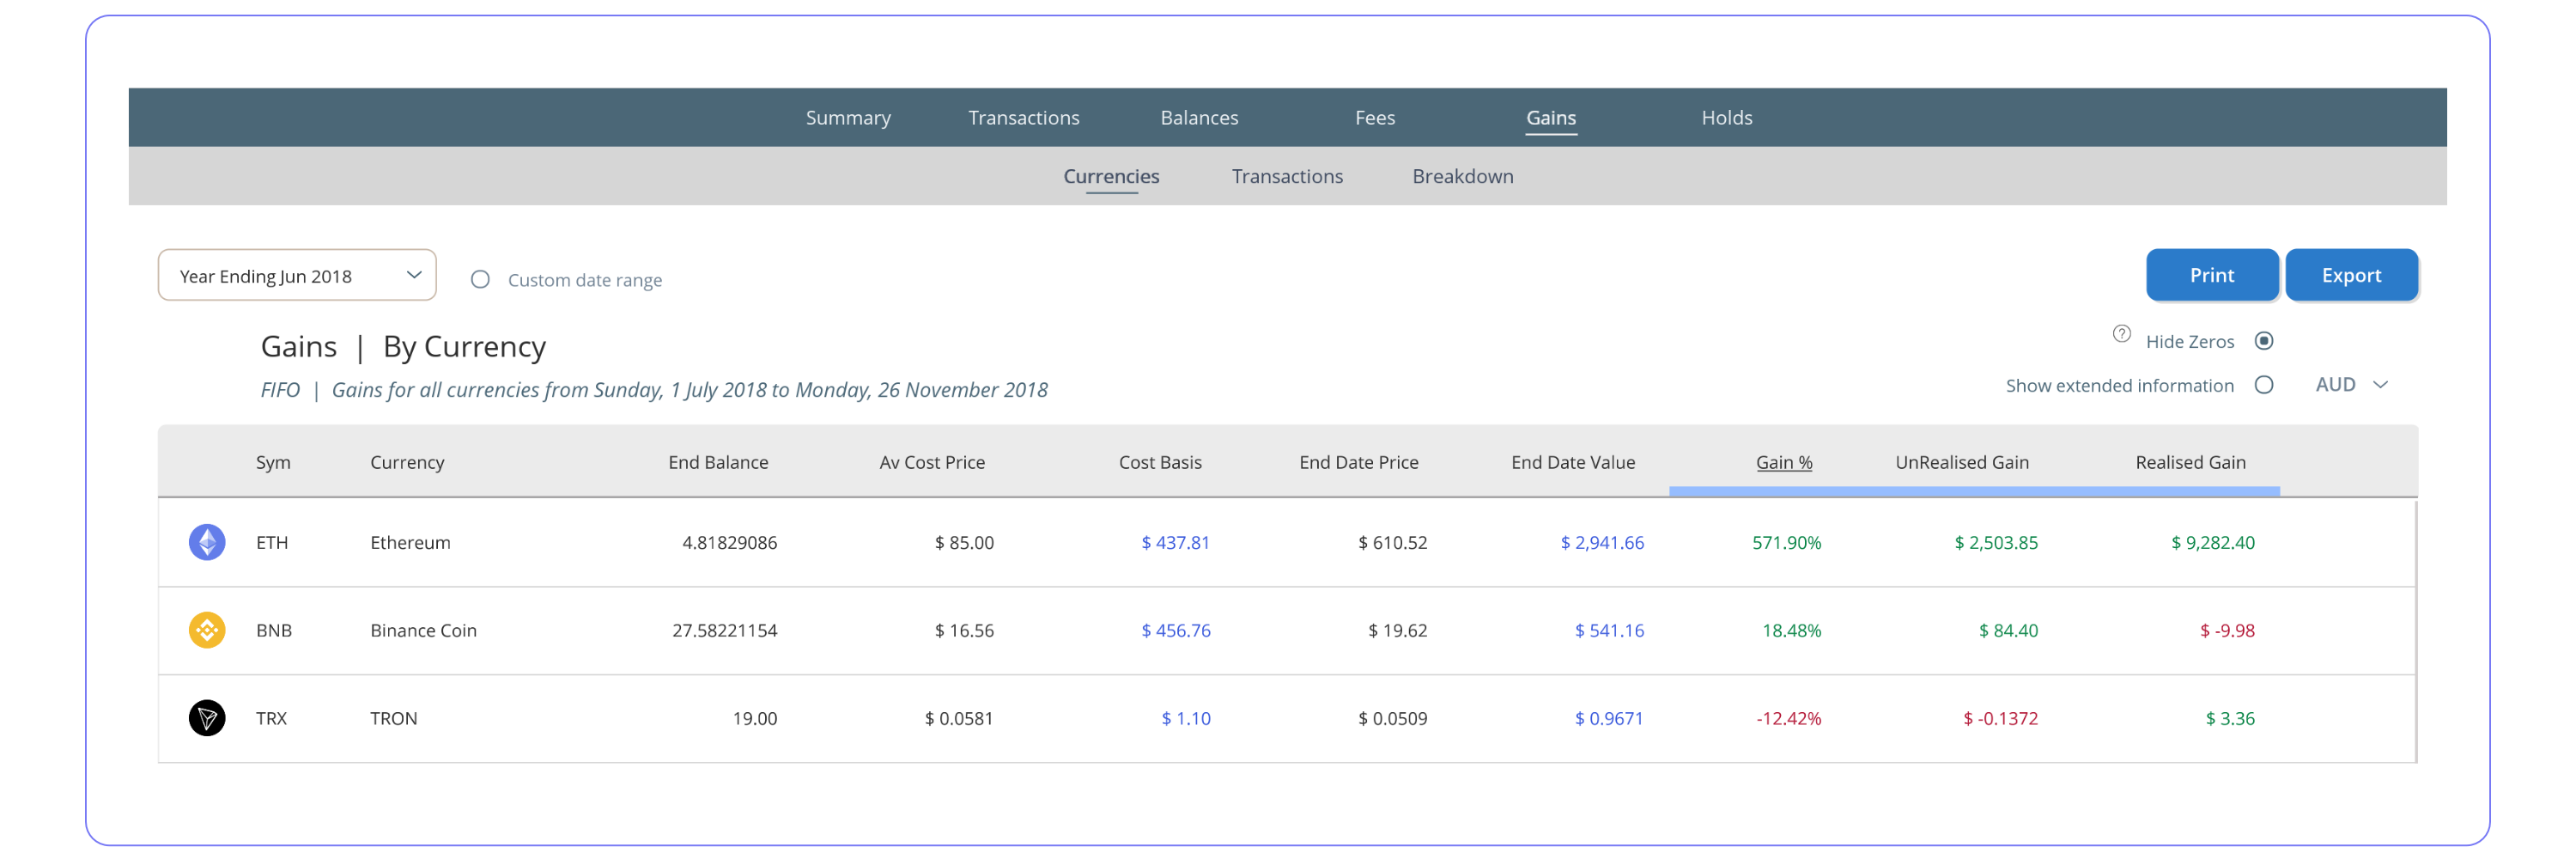
Gains is divided into three groups. Gains by Currency shows a breakdown for each currency. Shows cost basis, value, gain %, un/realised gain, min/max cost price, % short/long-term and earliest/latest cost date.
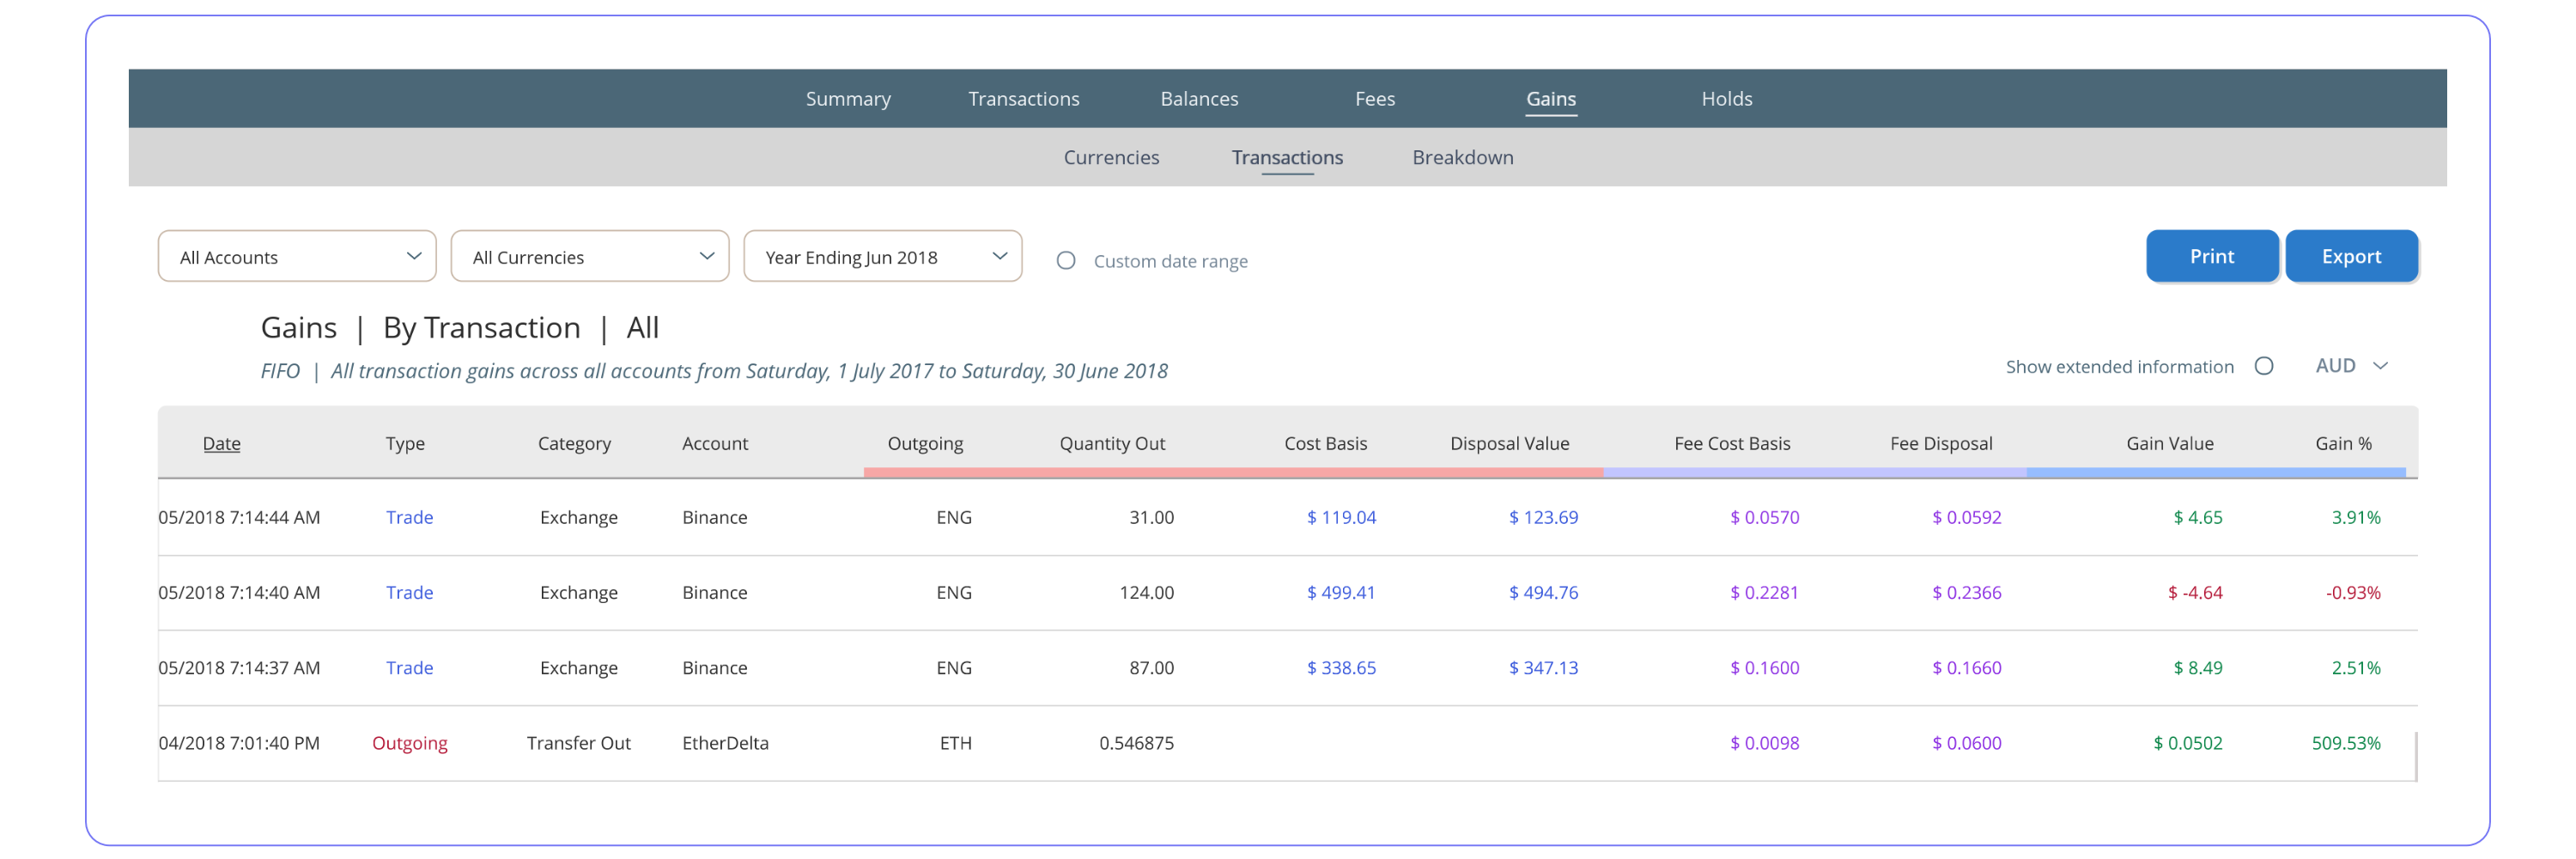
Gains by Transaction shows a breakdown of each transaction that has triggered a taxable event (disposal of an asset). Shows cost basis and disposal value for both the outgoing quantity and if for any fees paid. Gain value and gain %.
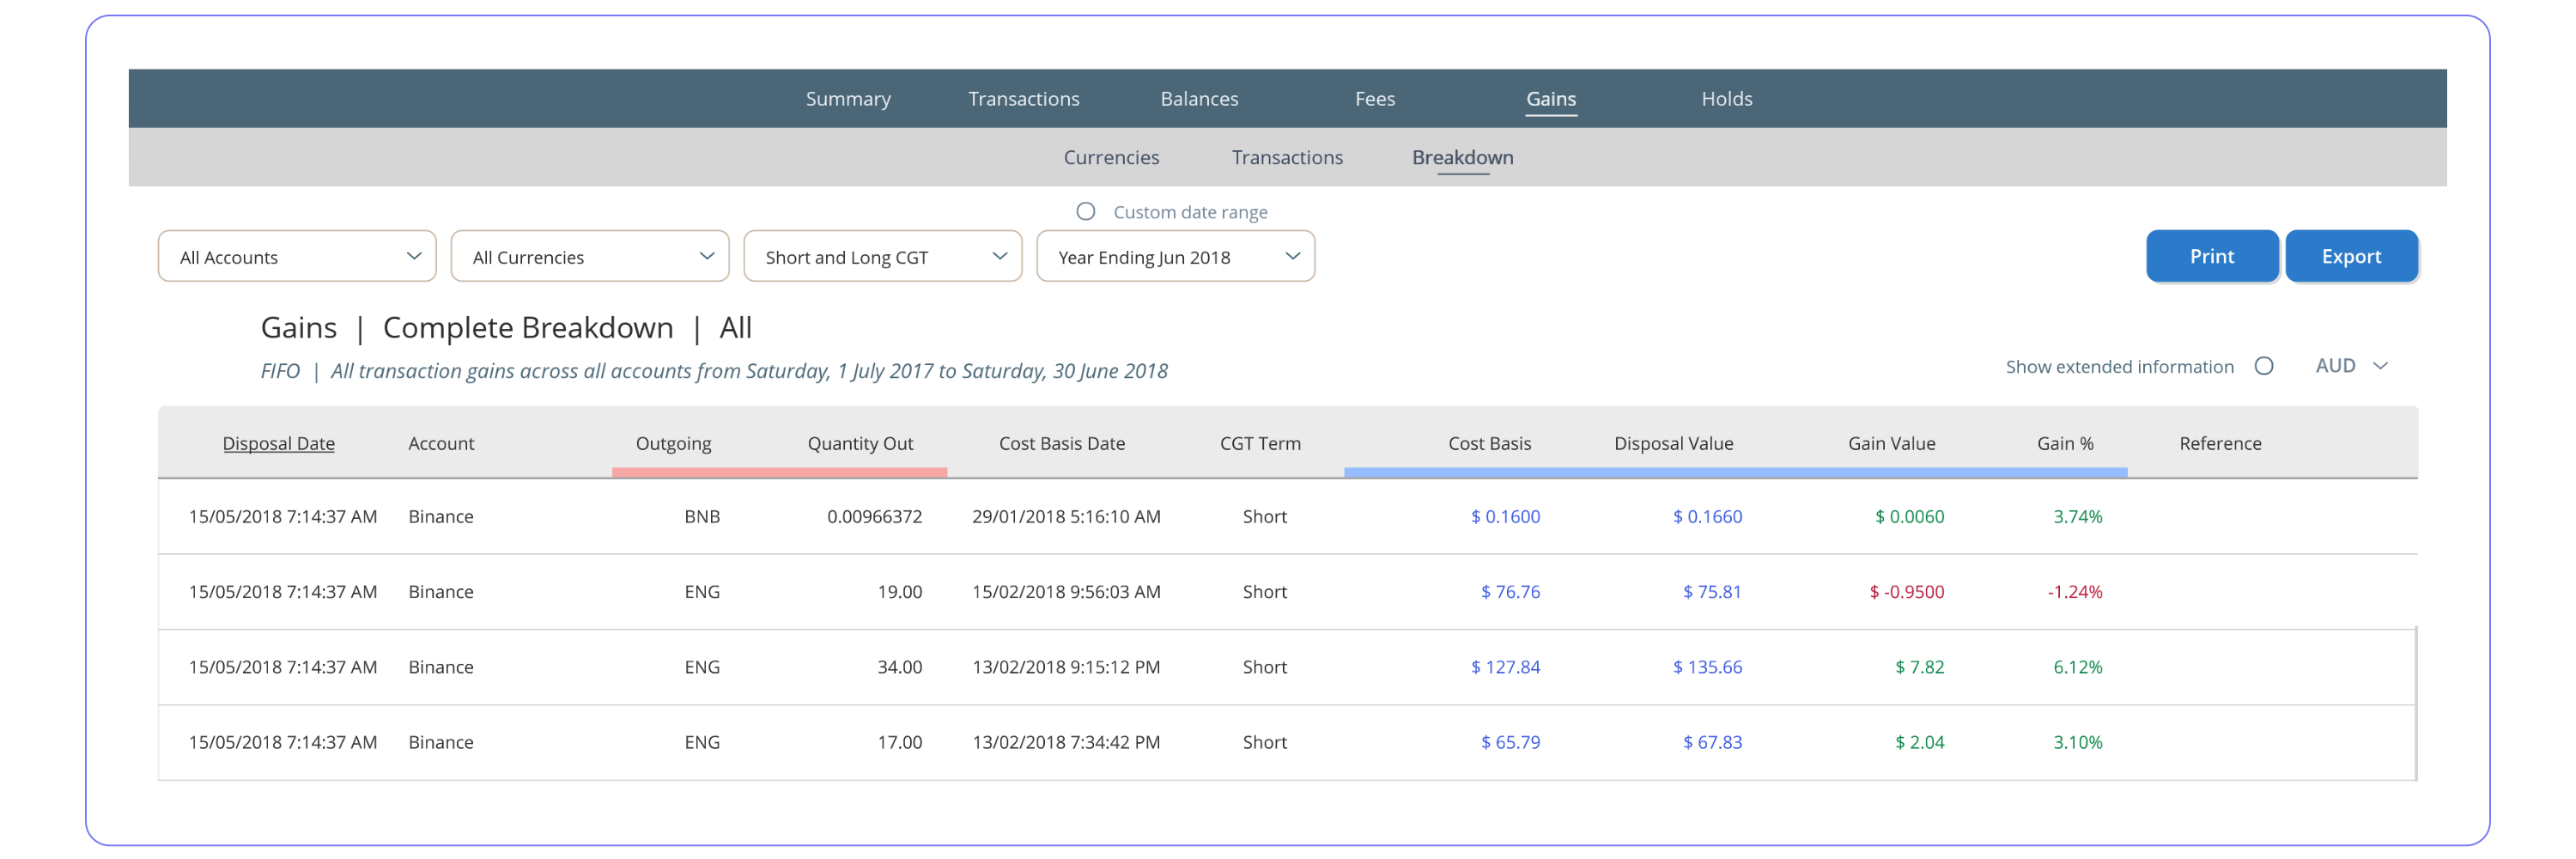
Gains Breakdown is a complete drill down into each taxable event showing the cost basis for each held asset used to makeup the disposed quantity. For example, your current position in BTC was built up over time from multiple buy transactions, you then decide to sell a large quantity in one transaction. This report will show a breakdown of the cost basis/buy date of every held portion of BTC used to makeup the amount you are selling. Also shows short/long-term, gain value and gain %.
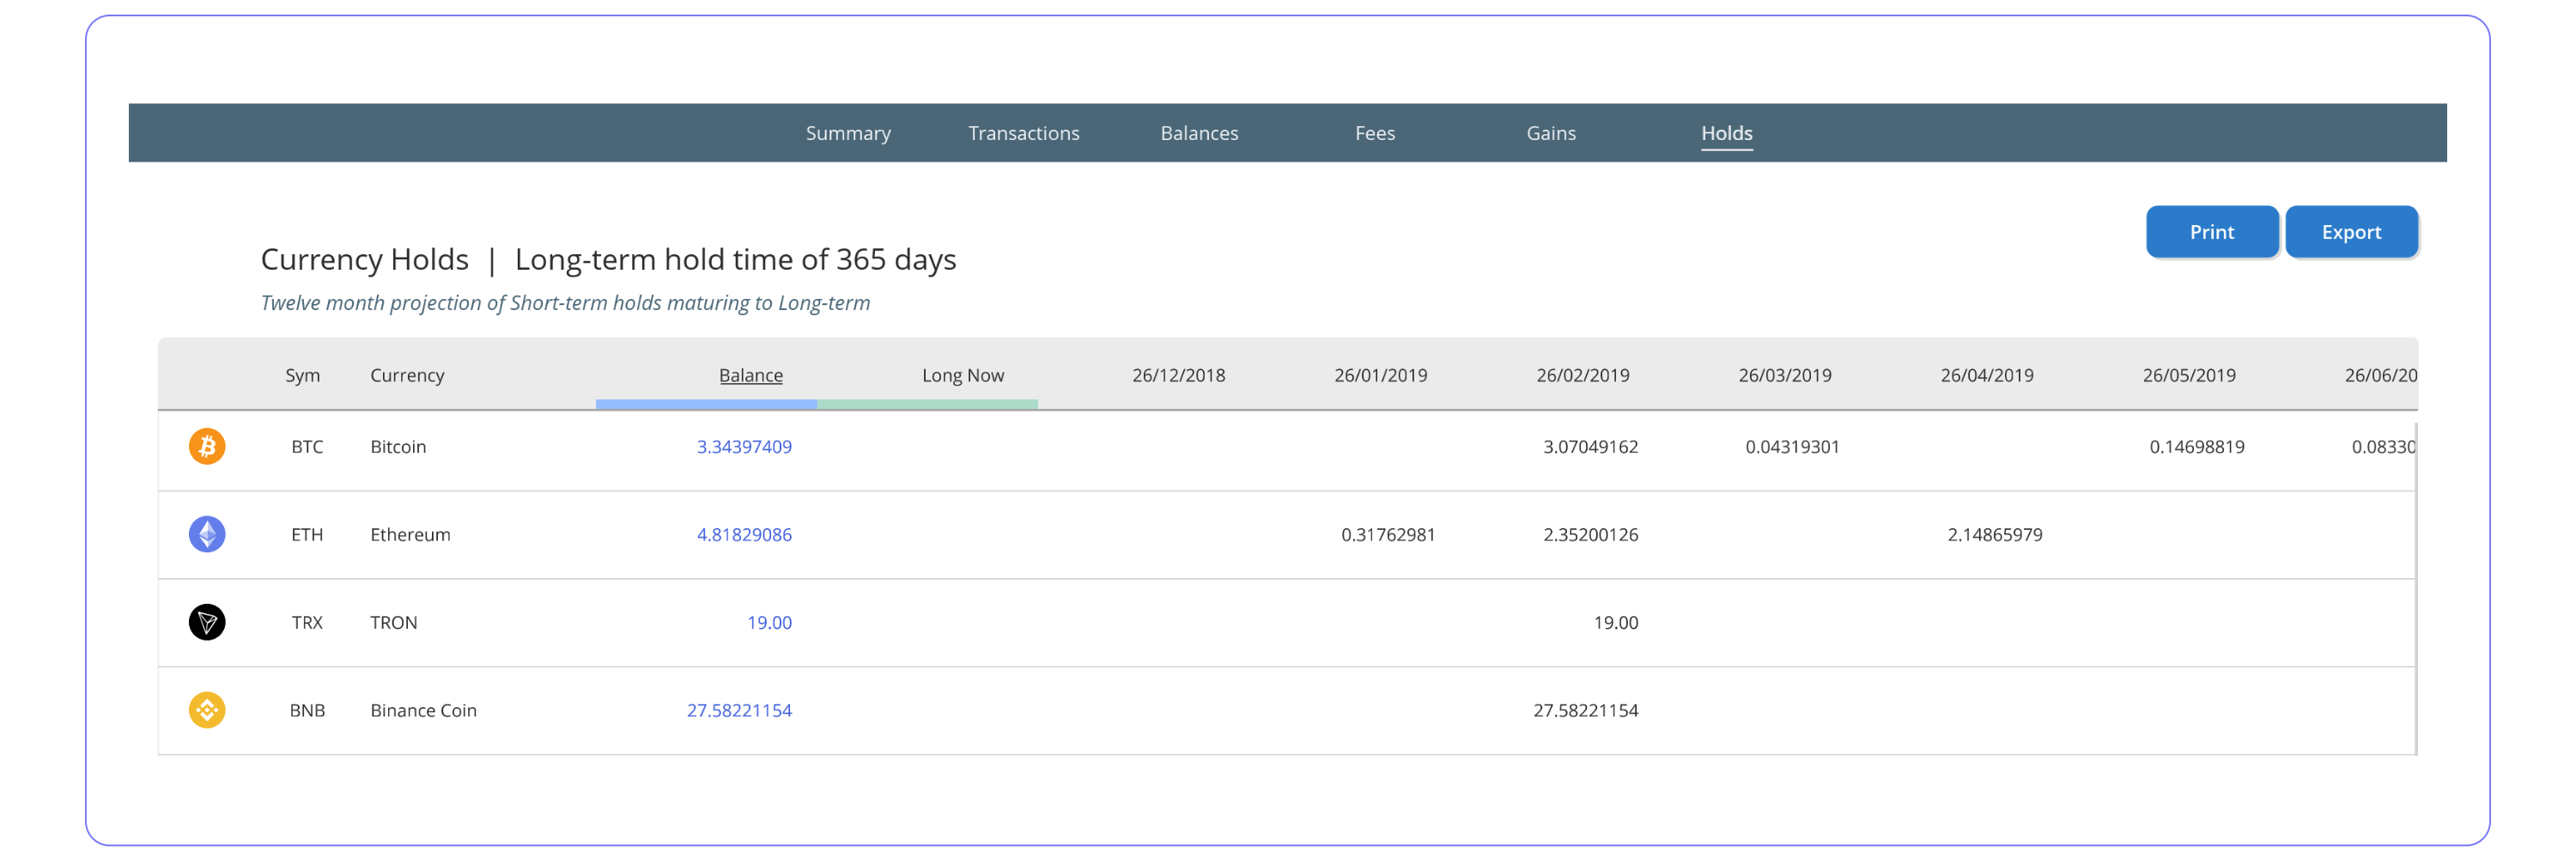
Holds is a table spanning twelve months showing when held assets will be deemed long-term as opposed to short-term.
Made by Ruff Robot Pty Ltd